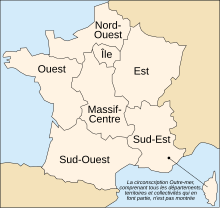
For elections in the European Union until 2014, and for European Parliament until 2019, East France is a European Parliament constituency. It consists of the regions of Grand Est, and Bourgogne-Franche-Comté.
| East France | |
|---|---|
| European Parliament constituency | |
 Location among the 2014 constituencies | |
 Shown within France | |
| Member state | France |
| Created | 2004 |
| MEPs | 10 |
| Sources | |
| [1][2][3] | |
Results
edit2009
edit| European Election 2009: East | |||||
|---|---|---|---|---|---|
| List | Candidates | Votes | Of total (%) | ± from prev. | |
| UMP | Joseph Daul Véronique Mathieu Arnaud Danjean Michèle Striffler |
635,016 | 29.18 | ||
| PS | Catherine Trautmann Liêm Hoang Ngoc |
374,971 | 17.24 | ||
| EELV | Sandrine Bélier | 310,620 | 14.27 | ||
| MoDem | Jean-François Kahn[1] | 205,256 | 9.43 | ||
| FN | Bruno Gollnisch | 164,672 | 7.57 | ||
| NPA | None | 122,767 | 5.65 | ||
| AEI | None | 92,613 | 4.26 | ||
| Libertas | None | 89,127 | 4.10 | ||
| FG | None | 84,632 | 3.89 | ||
| DLR | None | 50,698 | 2.34 | ||
| LO | None | 31,848 | 1.46 | ||
| Liberal Alternative | None | 5,721 | 0.26 | ||
| Eŭropo Demokratio Esperanto | None | 4,325 | 0.20 | ||
| Europe décroissance | None | 941 | 0.05 | ||
| AR | None | 749 | 0.04 | ||
| Newropeans | None | 307 | 0.02 | ||
| Communists | None | 198 | 0.01 | ||
| Humanist Party | None | 82 | 0.00 | ||
| Turnout | 2,289,221 | 39.10 | |||
2004
editBrackets indicate the number of votes per seat won.
| European Election 2004: East | |||||
|---|---|---|---|---|---|
| List | Candidates | Votes | Of total (%) | ± from prev. | |
| PS | Pierre Moscovici Catherine Trautmann Adeline Hazan Benoît Hamon |
631,989 (157,997.25) | 28.41 | ||
| UMP | Joseph Daul Véronique Mathieu |
391,929 (195,964.5) | 17.62 | ||
| UDF | Natalie Griesbeck Jean-Marie Beaupuy |
275,932 (137,966) | 12.40 | ||
| FN | Bruno Gollnisch | 270,852 | 12.17 | ||
| LV | Marie-Anne Isler-Beguin | 142,196 | 6.39 | ||
| MPF | None | 130,921 | 5.88 | ||
| PCF | None | 64,804 | 2.91 | ||
| MEI | None | 61,457 | 2.76 | ||
| Far left | None | 54,424 | 2.45 | ||
| Automobiliste vache à lait | None | 52,376 | 2.35 | ||
| RPF | None | 44,260 | 1.99 | ||
| La France d'en bas | None | 40,031 | 1.80 | ||
| Rassemblement des Contribuables Français | None | 21,546 | 0.97 | ||
| Workers' Party | None | 18,436 | 0.83 | ||
| MNR | None | 13,890 | 0.62 | ||
| Eŭropo Demokratio Esperanto | None | 5,341 | 0.24 | ||
| Vivre mieux avec l'Europe | None | 3,480 | 0.16 | ||
| AR | None | 499 | 0.02 | ||
| Parti Fédéraliste | None | 417 | 0.02 | ||
| Parti des Socioprofessionnels | None | 96 | 0.00 | ||
| Turnout | 2,224,876 | 40.87 | |||
Notes
edit- ^ Resigned after election, replaced by Nathalie Griesbeck