Emnambithi-Ladysmith Local Municipality
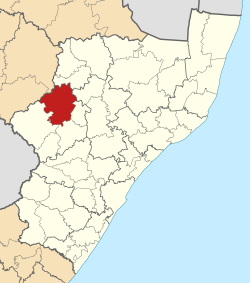
Emnambithi-Ladysmith Local Municipality was a municipality in the Uthukela District Municipality, KwaZulu-Natal, South Africa. It is accessible from the N3 and N11 national highways.
Emnambithi/Ladysmith | |
|---|---|
 Location of Emnambithi-Ladysmith Local Municipality within KwaZulu-Natal | |
| Coordinates: 28°33′S 29°47′E / 28.550°S 29.783°E | |
| Country | South Africa |
| Province | KwaZulu-Natal |
| District | uThukela |
| Seat | Ladysmith |
| Wards | 27 |
| Government | |
| • Type | Municipal council |
| • Mayor | Mrs D. C. P. Mazibuko |
| Area | |
• Total | 2,965 km2 (1,145 sq mi) |
| Population (2011)[2] | |
• Total | 237,437 |
| • Density | 80/km2 (210/sq mi) |
| Racial makeup (2011) | |
| • Black African | 91.8% |
| • Coloured | 1.0% |
| • Indian/Asian | 4.4% |
| • White | 2.7% |
| First languages (2011) | |
| • Zulu | 86.2% |
| • English | 7.4% |
| • Afrikaans | 2.2% |
| • Southern Ndebele | 1.1% |
| • Other | 3.1% |
| Time zone | UTC+2 (SAST) |
| Municipal code | KZN232 |
The town of Ladysmith is the economic hub of the municipality; it accommodates the municipal offices, major schools, main police station and magistrates court, as well as a variety of commercial, industrial, and retail outlets.[3]
After municipal elections on 3 August 2016 it was merged into the larger Alfred Duma Local Municipality.
Main places
editThe 2001 census divided the municipality into the following main places:[4]
| Place | Code | Area (km2) | Population | Most spoken language |
|---|---|---|---|---|
| Abantungwa/Kholwa | 51401 | 245.25 | 57,273 | Zulu |
| Colenso | 51402 | 4.90 | 4,476 | Zulu |
| Ezakheni | 51404 | 39.00 | 59,943 | Zulu |
| Kliprivier NU | 51406 | 2.80 | 381 | Zulu |
| Kliprivier | 51405 | 107.21 | 27,696 | Zulu |
| Ladysmith | 51407 | 91.97 | 41,425 | Zulu |
| Mchunu | 51408 | 34.42 | 2,301 | Zulu |
| Mthembu | 51409 | 80.70 | 6,920 | Zulu |
| Mvelani | 51410 | 2.43 | 11,898 | Zulu |
| Nkankezi | 51411 | 4.86 | 824 | Zulu |
| Remainder of the municipality | 51403 | 2,350.72 | 12,316 | Zulu |
Politics
editThe municipal council consists of fifty-three members elected by mixed-member proportional representation. Twenty-seven councillors are elected by first-past-the-post voting in twenty-seven wards, while the remaining twenty-six are chosen from party lists so that the total number of party representatives is proportional to the number of votes received. In the election of 18 May 2011 the African National Congress (ANC) won a majority of thirty-four seats on the council. The following table shows the results of the election.[5][6]
| Party | Votes | Seats | ||||||
|---|---|---|---|---|---|---|---|---|
| Ward | List | Total | % | Ward | List | Total | ||
| ANC | 38,323 | 39,333 | 77,656 | 63.4 | 25 | 9 | 34 | |
| IFP | 9,698 | 9,475 | 19,173 | 15.6 | 0 | 8 | 8 | |
| NFP | 6,978 | 6,630 | 13,608 | 11.1 | 0 | 6 | 6 | |
| DA | 4,746 | 4,664 | 9,410 | 7.7 | 2 | 2 | 4 | |
| MF | 662 | 507 | 1,169 | 1.0 | 0 | 1 | 1 | |
| ACDP | 348 | 318 | 666 | 0.5 | 0 | 0 | 0 | |
| AZAPO | 101 | 207 | 308 | 0.3 | 0 | 0 | 0 | |
| COPE | 96 | 146 | 242 | 0.2 | 0 | 0 | 0 | |
| Independent | 192 | – | 192 | 0.2 | 0 | – | 0 | |
| National Democratic Convention | 79 | 37 | 116 | 0.1 | 0 | 0 | 0 | |
| Total | 61,223 | 61,317 | 122,540 | 100.0 | 27 | 26 | 53 | |
| Spoilt votes | 994 | 894 | 1,888 | |||||
References
edit- ^ "Contact list: Executive Mayors". Government Communication & Information System. Archived from the original on 14 July 2010. Retrieved 22 February 2012.
- ^ a b c "Statistics by place". Statistics South Africa. Retrieved 27 September 2015.
- ^ Integrated Development Plan 2007/2008. Emnambithi-Ladysmith Municipality. Retrieved on Oct 10, 2009.
- ^ Lookup Tables - Statistics South Africa[permanent dead link]
- ^ "Results Summary – All Ballots: Emnambithi/Ladysmith" (PDF). Independent Electoral Commission. Retrieved 3 December 2013.
- ^ "Seat Calculation Detail: Emnambithi/Ladysmith" (PDF). Independent Electoral Commission. Retrieved 3 December 2013.
External links
edit
