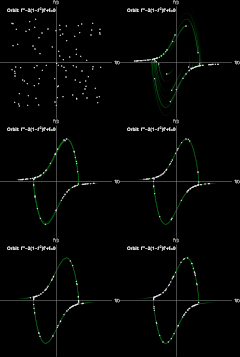
points1 = RandomReal[{-4, 4}, {100, 2}];
dim = Dimensions[points1][[1]];
psol1 = ParametricNDSolveValue[{x''[t] - 2 (1 - x[t]^2) x'[t] + x[t] == 0,
  x[0] == x0, x'[0] == v0}, {x}, {t, 0, 50}, {x0, v0}]

frames1 = Table[
  ParametricPlot[ Table[{psol1[points1[[j, 1]], points1[[j, 2]] ][[1]][t], psol1[points1[[j, 1]], points1[[j, 2]]][[1]]'[t]}, {j, 1, dim}], {t, 0, \[Tau]}, ColorFunction -> Function[{x, y, t}, Directive[ColorData["AvocadoColors"][t/\[Pi]] , Opacity[t^3] ] ], Background -> Black, PlotRange -> {{-5, 5}, {-5, 5}}, AspectRatio -> 1, Axes -> True, LabelStyle -> {White, FontSize -> 12}, AxesStyle -> White, Ticks -> None, AxesLabel -> {"f(t)", "f'(t)"}, Epilog -> {White, Style[Text["Orbit: f''-2(1-\!\(\*SuperscriptBox[\(f\), \(2\)]\))f'+f=0", {-2.2, 4.7}], Bold, FontSize -> 14], PointSize[0.01], Point[Table[{psol1[points1[[j, 1]], points1[[j, 2]] ][[1]][\[Tau]], psol1[points1[[j, 1]], points1[[j, 2]]][[1]]'[\[Tau]]}, {j, 1,dim}]]
     }
   ]
  , {\[Tau], 10^-3, 7, 7/50}];
ListAnimate[Join[Table[frames1[[1]], {5}], frames1]]

