Original file (1,566 × 1,102 pixels, file size: 46 KB, MIME type: image/png)
| This is a file from the Wikimedia Commons. Information from its description page there is shown below. Commons is a freely licensed media file repository. You can help. |
Summary
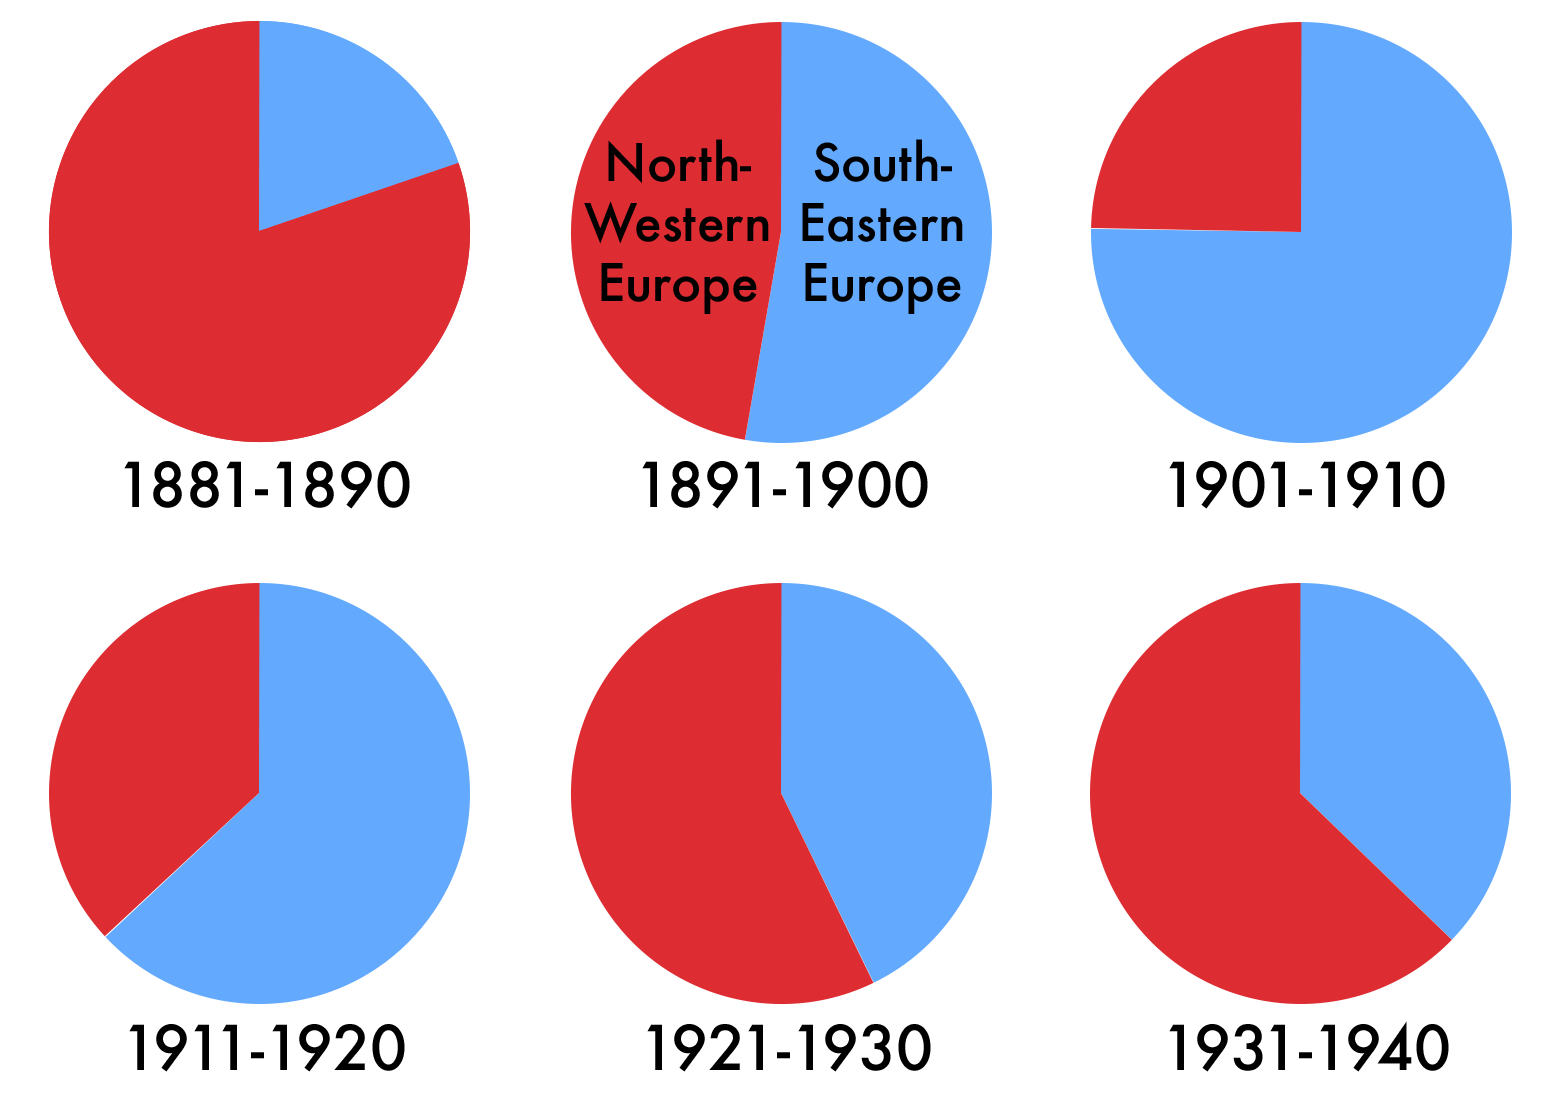
Relative proportions of European immigrants to the United States from 1881-1940 from North-Western and South-Eastern Europe, by decade. The effects of immigration restriction legislation in the early 1920s can be easily seen.
Created by User:Fastfission in Microsoft Excel and Adobe Photoshop. Font is Futura Medium.
Source
Data derived from Statistical Abstract of the United States, 1942, Chart No. 113: "Immigration, by Country of Origin, by Decades 1851-1940." The numbers used for these charts were:
| 1881-1890 | 1891-1900 | 1901-1910 | 1911-1920 | 1921-1930 | 1931-1940 | |
|---|---|---|---|---|---|---|
| South-Eastern Europe | 936334 | 1879125 | 6128232 | 2758267 | 1063013 | 129174 |
| North-Western Europe | 3800652 | 1680453 | 2007784 | 1618297 | 1414760 | 219123 |
The numbers are not precise but the proportions should be accurate. Known errors are that some of the countries are counted differently depending on the period in time (Austria gets counted with Germany sometimes, with Hungary others). There were no doubt some transcription errors too as the copy of this volume on Google Books is somewhat hard to read. The distinction between "North Western" and "South Eastern" was made primarily by me, with reference to the categories used on this page which I thought seemed sensible.
Licensing
| This work has been released into the public domain by its author, Fastfission. This applies worldwide. In some countries this may not be legally possible; if so: |
If you want to credit someone, credit "Wikimedia Commons." Otherwise don't credit anyone, that's fine by me. --Fastfission 15:12, 14 April 2008 (UTC)
File history
Click on a date/time to view the file as it appeared at that time.
| Date/Time | Thumbnail | Dimensions | User | Comment | |
|---|---|---|---|---|---|
| current | 18:00, 27 July 2006 | | 1,566 × 1,102 (46 KB) | Fastfission~commonswiki | Relative proportions of European immigrants to the United States from 1881-1940 from North-Western and South-Eastern Europe, by decade. The effects of immigration restriction legislation in the early 1920s can be easily seen. Created by [[User:Fastfissio |
File usage
The following page uses this file:
Global file usage
The following other wikis use this file:
- Usage on de.wikipedia.org
- Usage on en.wikiversity.org
- Usage on fr.wikipedia.org