No higher resolution available.
Friedmans_mars_hinge_functions.png (280 × 220 pixels, file size: 2 KB, MIME type: image/png)
| This is a file from the Wikimedia Commons. Information from its description page there is shown below. Commons is a freely licensed media file repository. You can help. |
Summary
| Description |
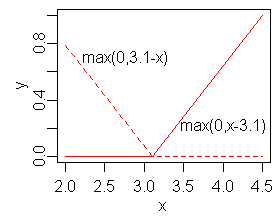
English: Plot of hinge functions to illustrate Friedman's Multivariate Adaptive Regression Splines (MARS) |
| Date | |
| Source | Created by the author using the R programming language |
| Author | Stephen Milborrow |
Created in R using the following program
x <- c(2, 3.1, 4.5)
y <- c(0, 0, 1)
y1 <- c(.786, 0.005, 0.005)
png(filename="friedmans_mars_hinge_functions.png",pointsize=16,width=280, height=220)
par(mar = c(3, 3, .5, 0.5))
par(mgp = c(1.6, 0.6, 0)) # flatten axis elements
plot(x,y, type="l", col="red")
lines(x, y1, lty=2, col="red")
text(2.76, .7, "max(0,3.1-x)")
text(4.0, .22, "max(0,x-3.1)")
dev.off()
Licensing
| I, the copyright holder of this work, release this work into the public domain. This applies worldwide. In some countries this may not be legally possible; if so: I grant anyone the right to use this work for any purpose, without any conditions, unless such conditions are required by law. |
File history
Click on a date/time to view the file as it appeared at that time.
| Date/Time | Thumbnail | Dimensions | User | Comment | |
|---|---|---|---|---|---|
| current | 11:58, 17 July 2008 | | 280 × 220 (2 KB) | Stephen Milborrow | {{Information |Description={{en|1=Plot of hinge functions to illustrate Friedman's Multivariate Adaptive Regression Splines (MARS)}} |Source=Created by the author using the R programming language |Author=Stephen Milborrow |Date= |
File usage
The following 2 pages use this file: