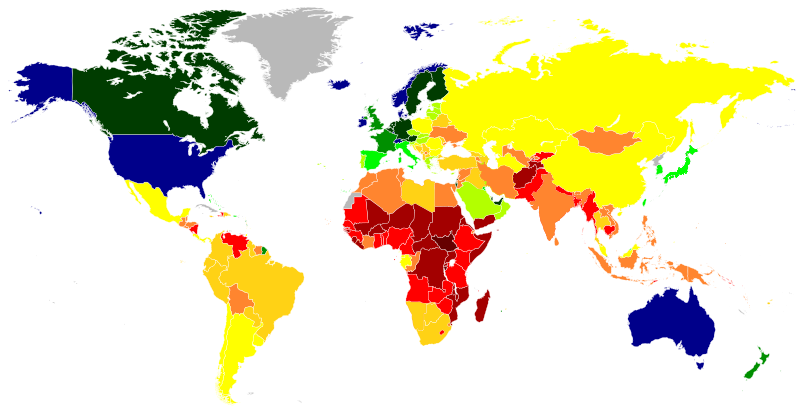
Size of this PNG preview of this SVG file: 800 × 414 pixels. Other resolutions: 320 × 166 pixels | 640 × 331 pixels | 1,024 × 530 pixels | 1,280 × 663 pixels | 2,560 × 1,326 pixels | 2,192 × 1,135 pixels.
Original file (SVG file, nominally 2,192 × 1,135 pixels, file size: 2.18 MB)
File history
Click on a date/time to view the file as it appeared at that time.
| Date/Time | Thumbnail | Dimensions | User | Comment | |
|---|---|---|---|---|---|
| current | 23:26, 15 May 2023 |  | 2,192 × 1,135 (2.18 MB) | Shoxuzb | fixed |
| 22:51, 15 May 2023 |  | 2,192 × 1,135 (2.18 MB) | Shoxuzb | minor | |
| 16:08, 11 June 2022 |  | 2,192 × 1,135 (2.18 MB) | Titanx114 | Updated Azerbaizan, Japan and Liberia as per list of 2022 | |
| 15:22, 10 June 2022 |  | 2,192 × 1,135 (1.9 MB) | Titanx114 | Updated some countries as per list of 2022 | |
| 20:58, 5 June 2022 |  | 2,192 × 1,135 (1.61 MB) | Allice Hunter | New Zealand and other Oceanian countries | |
| 22:44, 4 June 2022 |  | 2,192 × 1,135 (1.58 MB) | Allice Hunter | Uploaded a work by {{u|Allice Hunter}} and {{u|Snowballa68}} from *Blank map: File:World map (Miller cylindrical projection, blank).svg * Data from IMF: {{cite web|date=April 2021|title=World Economic Outlook Database, April 2022|url=https://www.imf.org/en/Publications/WEO/weo-database/2022/April/weo-report?c=512,914,612,614,311,213,911,314,193,122,912,313,419,513,316,913,124,339,638,514,218,963,616,223,516,918,748,618,624,522,622,156,626,628,228,924,233,632,636,634,238,662,960,423,935,1... |
File usage
The following page uses this file:
Global file usage
The following other wikis use this file:
- Usage on ar.wikipedia.org
- Usage on bn.wikipedia.org
- Usage on ceb.wikipedia.org
- Usage on et.wikipedia.org
- Usage on fi.wikipedia.org
- Usage on he.wikipedia.org
- Usage on hi.wikipedia.org
- Usage on hy.wikipedia.org
- Usage on id.wikipedia.org
- Usage on ja.wikipedia.org
- Usage on ko.wikipedia.org
- Usage on simple.wikipedia.org
- Usage on tr.wikipedia.org
- Usage on zh.wikipedia.org