Size of this preview: 800 × 572 pixels. Other resolutions: 320 × 229 pixels | 640 × 458 pixels | 1,024 × 733 pixels | 1,230 × 880 pixels.
Original file (1,230 × 880 pixels, file size: 182 KB, MIME type: image/png)
File history
Click on a date/time to view the file as it appeared at that time.
| Date/Time | Thumbnail | Dimensions | User | Comment | |
|---|---|---|---|---|---|
| current | 22:20, 2 March 2008 |  | 1,230 × 880 (182 KB) | Mattflaschen | More reasonable size. |
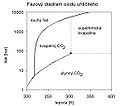
| 22:08, 29 July 2005 |  | 4,919 × 3,519 (434 KB) | Saperaud~commonswiki | Graph of phase change temperatures and pressures of carbon dioxide. I think i can release this as public domain, but the people who publish the data may hold copyright to that. Data source: http://www.chemicalogic.com/co2tab/downloads.htm Source: engli |
File usage
The following page uses this file:
Global file usage
The following other wikis use this file:
- Usage on azb.wikipedia.org
- Usage on ro.wiktionary.org


