
Size of this PNG preview of this SVG file: 747 × 567 pixels. Other resolutions: 316 × 240 pixels | 633 × 480 pixels | 1,012 × 768 pixels | 1,280 × 972 pixels | 2,560 × 1,943 pixels.
Original file (SVG file, nominally 747 × 567 pixels, file size: 322 KB)
| This is a file from the Wikimedia Commons. Information from its description page there is shown below. Commons is a freely licensed media file repository. You can help. |
Summary
| Description |
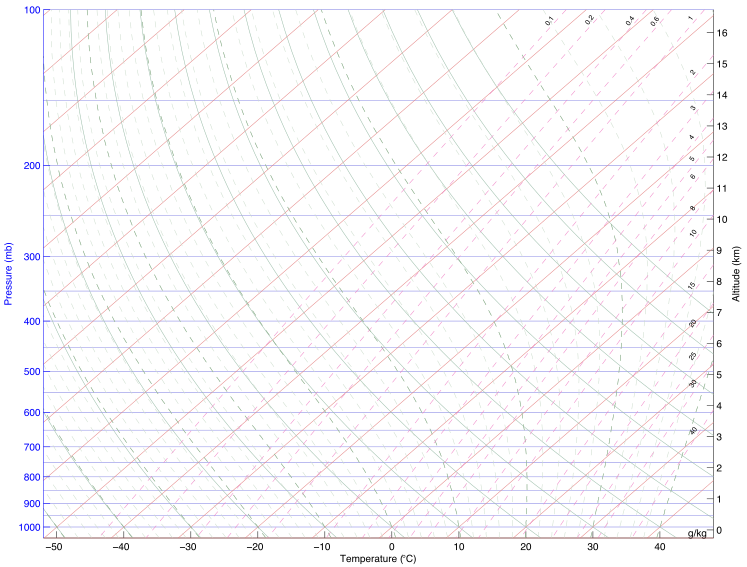
English: This is a Skew-T log-P diagram, one of the four Thermodynamic diagrams in use around the world to plot atmospheric data of Temperature versus Humidity with height.
Red lines are isotherms, solid green lines are the potential temperature, and dashed green lines are the equivalent potential temperature; these three all use the temperature scale at the horizontal 1000 mb level near the bottom. The blue lines are the isobars (scale on the left side) and the dashed pink lines are the saturated humidity mixing ratio (scale inside the graph, near the right). |
| Date | 1 November 2006 (original upload date) |
| Source |
Own work English: Created for an Atmospheric Physics class at UMBC. |
| Author | Paulschou at English Wikipedia |
Licensing
| This work has been released into the public domain by its author, Paulschou at English Wikipedia. This applies worldwide. In some countries this may not be legally possible; if so: Paulschou grants anyone the right to use this work for any purpose, without any conditions, unless such conditions are required by law. |
Original upload log
The original description page was here. All following user names refer to en.wikipedia.
| Date/Time | Dimensions | User | Comment |
|---|---|---|---|
| 2006-11-01 16:10 | 747×567× (329354 bytes) | Paulschou | Created for my Atmospheric Physics class at UMBC. |
File history
Click on a date/time to view the file as it appeared at that time.
| Date/Time | Thumbnail | Dimensions | User | Comment | |
|---|---|---|---|---|---|
| current | 11:09, 10 September 2017 | | 747 × 567 (322 KB) | RainerBlome | Transferred from en.wikipedia |
File usage
No pages on the English Wikipedia use this file (pages on other projects are not listed).
Global file usage
The following other wikis use this file:
- Usage on pl.wikipedia.org