
Size of this preview: 800 × 520 pixels. Other resolutions: 320 × 208 pixels | 640 × 416 pixels | 1,024 × 666 pixels | 1,500 × 975 pixels.
Original file (1,500 × 975 pixels, file size: 211 KB, MIME type: image/png)
| This is a file from the Wikimedia Commons. Information from its description page there is shown below. Commons is a freely licensed media file repository. You can help. |
Summary
| Description |
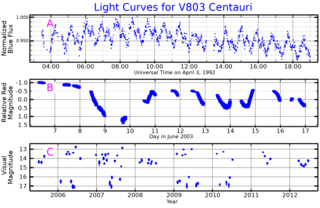
English: Three light curves for V803 Centauri. Plot A shows that variability on a timescale of hours, plot B shows the variability on a timescale of days, and plot C shows the variability on a timescale of years. Adapted from Patterson et al., PASP, 112 : 625È631, 2000 May, Kato et al., PASJ: Publ. Astron. Soc. Japan 56, S89–S98, 2004 March 25 and Levitan et al., MNRAS 446, 391–410 (2015) |
| Date | |
| Source | Own work |
| Author | PopePompus |
Licensing
I, the copyright holder of this work, hereby publish it under the following license:
This file is licensed under the Creative Commons Attribution-Share Alike 4.0 International license.
- You are free:
- to share – to copy, distribute and transmit the work
- to remix – to adapt the work
- Under the following conditions:
- attribution – You must give appropriate credit, provide a link to the license, and indicate if changes were made. You may do so in any reasonable manner, but not in any way that suggests the licensor endorses you or your use.
- share alike – If you remix, transform, or build upon the material, you must distribute your contributions under the same or compatible license as the original.
File history
Click on a date/time to view the file as it appeared at that time.
| Date/Time | Thumbnail | Dimensions | User | Comment | |
|---|---|---|---|---|---|
| current | 01:22, 2 December 2021 | | 1,500 × 975 (211 KB) | PopePompus | Cross-wiki upload from en.wikipedia.org |
File usage
The following page uses this file:
Global file usage
The following other wikis use this file:
- Usage on pt.wikipedia.org
- Usage on sv.wikipedia.org
- Usage on www.wikidata.org