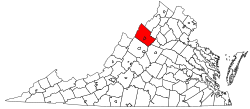
The Harrisonburg Metropolitan Statistical Area is a Metropolitan Statistical Area (MSA) in Virginia as defined by the United States Office of Management and Budget (OMB). As of the 2020 census, the MSA had a population of 135,571 (though a July 1, 2021 estimate placed the population at 135,824).
Harrisonburg Metropolitan Statistical Area | |
|---|---|
 Location of the Harrisonburg Metropolitan Statistical Area in Virginia | |
| Country | |
| State | |
| Largest city | Harrisonburg |
| Area | |
• Total | 870.69 sq mi (2,255.1 km2) |
| • Land | 866.34 sq mi (2,243.8 km2) |
| • Water | 4.35 sq mi (11.3 km2) 0.5% |
| Population | |
• Total | 135,571 (US: 302nd) |
| Time zone | UTC−5 (EST) |
| • Summer (DST) | UTC−4 (EDT) |
| ZIP codes | 22801–22803, 22807, 22811, 22812, 22815, 22820, 22821, 22827, 22830–22834, 22840, 22841, 22844, 22846, 22848–22850, 22853, 24441, 24471 |
| Area code | 540 |
| FIPS code 6-4 | 25500 |
MSA components
editNote: Since a state constitutional change in 1871, all cities in Virginia are independent cities that are not located in any county. The OMB considers these independent cities to be county-equivalents for the purpose of defining MSAs in Virginia.
One county and one independent city are included in the Harrisonburg Metropolitan Statistical Area.[2]
- Counties
- Independent Cities
Communities
editIncorporated places
edit- Bridgewater
- Broadway
- Dayton
- Elkton
- Grottoes (partial)
- Harrisonburg (Principal city)
- Mount Crawford
- Timberville
Census-designated places
editNote: All census-designated places are unincorporated.
Other unincorporated places
editIndependent city
editAs an independent city, Harrisonburg is not a part of Rockingham County, despite its status as the county seat.
Demographics
editAs of the census[3] of 2000, there were 108,193 people, 38,488 households, and 25,337 families residing within the MSA. The racial makeup of the MSA was 92.19% White, 3.07% African American, 0.15% Native American, 1.35% Asian, 0.02% Pacific Islander, 1.82% from other races, and 1.42% from two or more races. Hispanic or Latino of any race were 5.36% of the population.
The median income for a household in the MSA was $35,349, and the median income for a family was $45,711. Males had a median income of $30,285 versus $22,403 for females. The per capita income for the MSA was $16,847.
See also
editReferences
edit- ^ "2020 Population and Housing State Data". United States Census Bureau, Population Division. August 12, 2021. Retrieved April 30, 2022.
- ^ "Metropolitan Statistical Areas and Components" (TXT). Metropolitan statistical areas and metropolitan divisions defined by the Office of Management and Budget, November 2007. United States Census Bureau, Population Division. 2008-06-24. Retrieved 2008-09-05.
- ^ "U.S. Census website". United States Census Bureau. Retrieved 2008-01-31.