1998 Nevada gubernatorial election
(Redirected from Nevada gubernatorial election, 1998)
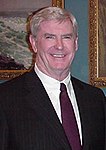
The 1998 Nevada gubernatorial election occurred on November 3, 1998. Incumbent Democrat Bob Miller was term limited. Republican nominee Kenny Guinn defeated Democratic nominee Jan Laverty Jones to become Governor of Nevada.
| |||||||||||||||||
| |||||||||||||||||
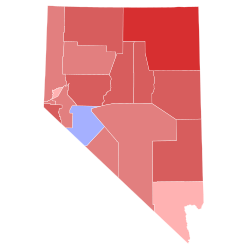
 County results Guinn: 40–50% 50–60% 60–70% 70–80% Jones: 40–50% | |||||||||||||||||
| |||||||||||||||||
This was the first open seat Nevada gubernatorial election since 1978, with Guinn becoming the first Republican elected as Nevada Governor since Robert List was elected in that same election.
Democratic primary
editCandidates
edit- Caeser D. Adamson
- Jim Champagne
- Patrick Matthew "Pat" Fitzpatrick, perennial candidate
- John Geremia
- Jan Laverty Jones, Mayor of Las Vegas
- Joe Neal, Nevada State Senator
- Carlo Poliak, perennial candidate
- Barbara Scott, public accountant
- Burvle "Ed" Swindle
Results
edit| Party | Candidate | Votes | % | |
|---|---|---|---|---|
| Democratic | Jan Laverty Jones | 62,495 | 59.62% | |
| Democratic | Joe Neal | 16,646 | 15.88% | |
| None of These Candidates | 12,857 | 12.27% | ||
| Democratic | Patrick Matthew "Pat" Fitzpatrick | 3,468 | 3.31% | |
| Democratic | Barbara Scott | 3,213 | 3.07% | |
| Democratic | Jim Champagne | 1,964 | 1.87% | |
| Democratic | Burvle "Ed" Swindle | 1,591 | 1.52% | |
| Democratic | Caeser D. Adamson | 1,178 | 1.12% | |
| Democratic | John Geremia | 781 | 0.75% | |
| Democratic | Carlo Poliak | 630 | 0.60% | |
| Total votes | 104,823 | 100.00% | ||
Republican primary
editCandidates
edit- Kenny Guinn, businessman
- Lonnie Hammargren, Lieutenant Governor
- Aaron Russo, businessman and film producer
- Bruce Westcott, businessman
Results
edit| Party | Candidate | Votes | % | |
|---|---|---|---|---|
| Republican | Kenny Guinn | 76,953 | 58.14% | |
| Republican | Aaron Russo | 34,251 | 25.88% | |
| Republican | Lonnie Hammargren | 13,410 | 10.13% | |
| None of These Candidates | 5,783 | 4.37% | ||
| Republican | Bruce Westcott | 1,956 | 1.48% | |
| Total votes | 132,353 | 100.00% | ||
General election
editResults
edit| Party | Candidate | Votes | % | ±% | |
|---|---|---|---|---|---|
| Republican | Kenny Guinn | 223,892 | 51.63% | +10.31% | |
| Democratic | Jan Laverty Jones | 182,281 | 42.04% | −10.65% | |
| None of These Candidates | 12,641 | 2.92% | +0.60% | ||
| Independent American | Chuck Horne | 7,509 | 1.73% | −0.91% | |
| Libertarian | Terry C. Savage | 7,307 | 1.69% | +0.64% | |
| Majority | 41,611 | 9.60% | |||
| Total votes | 433,630 | 100.00% | |||
| Republican gain from Democratic | Swing | +20.86% | |||
County results
edit| County | Kenny Guinn Republican |
Jan Laverty Jones Democratic |
None of These Candidates | Chuck Horne Independent American |
Terry C. Savage Libertarian |
Margin | Total votes cast[2] | ||||||
|---|---|---|---|---|---|---|---|---|---|---|---|---|---|
| # | % | # | % | # | % | # | % | # | % | # | % | ||
| Carson City | 8,763 | 52.46% | 6,976 | 41.76% | 490 | 2.93% | 248 | 1.48% | 277 | 1.36% | 1,787 | 10.70% | 16,704 |
| Churchill | 4,593 | 63.52% | 2,138 | 29.57% | 218 | 3.01% | 168 | 2.32% | 114 | 1.58% | 2,455 | 33.95% | 7,231 |
| Clark | 125,926 | 49.82% | 111,641 | 44.17% | 6,698 | 2.65% | 4,580 | 1.81% | 3,900 | 1.54% | 14,285 | 5.65% | 252,745 |
| Douglas | 8,783 | 60.92% | 4,727 | 32.79% | 439 | 3.04% | 240 | 1.66% | 229 | 1.59% | 4,056 | 28.13% | 14,418 |
| Elko | 7,352 | 72.95% | 1,990 | 19.75% | 278 | 2.76% | 255 | 2.53% | 203 | 2.01% | 5,362 | 53.21% | 10,078 |
| Esmeralda | 319 | 59.51% | 138 | 25.75% | 40 | 7.46% | 24 | 4.48% | 15 | 2.80% | 181 | 33.77% | 536 |
| Eureka | 461 | 68.50% | 151 | 22.44% | 26 | 3.86% | 16 | 2.38% | 19 | 2.82% | 310 | 46.06% | 673 |
| Humboldt | 2,627 | 62.10% | 1,271 | 30.05% | 175 | 4.14% | 89 | 2.10% | 68 | 1.61% | 1,356 | 32.06% | 4,230 |
| Lander | 1,331 | 64.58% | 551 | 26.73% | 98 | 4.75% | 41 | 1.99% | 40 | 1.94% | 780 | 37.85% | 2,061 |
| Lincoln | 1,204 | 61.68% | 549 | 28.13% | 65 | 3.33% | 102 | 5.23% | 32 | 1.64% | 655 | 33.56% | 1,952 |
| Lyon | 5,042 | 54.25% | 3,576 | 38.48% | 318 | 3.42% | 171 | 1.84% | 187 | 2.01% | 1,466 | 15.77% | 9,294 |
| Mineral | 951 | 43.95% | 1,012 | 46.77% | 120 | 5.55% | 48 | 2.22% | 33 | 1.52% | -61 | -2.82% | 2,164 |
| Nye | 4,844 | 51.05% | 3,884 | 40.93% | 270 | 2.85% | 207 | 2.18% | 284 | 2.99% | 960 | 10.12% | 9,489 |
| Pershing | 876 | 56.30% | 562 | 36.12% | 63 | 4.05% | 29 | 1.86% | 26 | 1.67% | 314 | 20.18% | 1,556 |
| Storey | 790 | 47.19% | 704 | 42.05% | 85 | 5.08% | 45 | 2.69% | 50 | 2.99% | 86 | 5.14% | 1,674 |
| Washoe | 47,962 | 50.22% | 41,409 | 43.36% | 3,153 | 3.30% | 1,144 | 1.20% | 1,842 | 1.93% | 6,553 | 6.86% | 95,510 |
| White Pine | 2,068 | 62.38% | 1,002 | 30.23% | 105 | 3.17% | 102 | 3.08% | 38 | 1.15% | 1,066 | 32.16% | 3,315 |
| Totals | 223,892 | 51.63% | 182,281 | 42.04% | 12,641 | 2.92% | 7,509 | 1.73% | 7,307 | 1.69% | 41,611 | 9.60% | 433,630 |
Counties that flipped from Democratic to Republican
editReferences
edit- ^ a b "1998 Official Primary Election Results" (PDF). Nevada Secretary of State. Retrieved June 26, 2018.
- ^ a b "1998 Official General Election Returns" (PDF). Nevada Secretary of State. Retrieved June 26, 2018.

