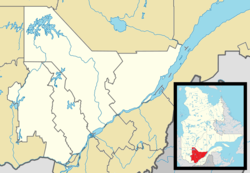
Sainte-Brigitte-de-Laval (French pronunciation: [sɛ̃t bʁiʒit də laval]) is a city in La Jacques-Cartier Regional County Municipality in the Capitale-Nationale region of Quebec, Canada. Its urban area is located in the hollow of the Montmorency River valley, northeast of Quebec City.
Sainte-Brigitte-de-Laval | |
|---|---|
 Lac Poulin | |
| Motto: Dieu ayde | |
 Location within La Jacques-Cartier RCM | |
| Coordinates: 47°00′N 71°12′W / 47.000°N 71.200°W[1] | |
| Country | Canada |
| Province | Quebec |
| Region | Capitale-Nationale |
| RCM | La Jacques-Cartier |
| Settled | c. 1830 |
| Constituted | February 11, 1875 |
| Government | |
| • Mayor | France Fortier |
| • Federal riding | Portneuf—Jacques-Cartier |
| • Prov. riding | Montmorency |
| Area | |
• Total | 110.40 km2 (42.63 sq mi) |
| • Land | 108.42 km2 (41.86 sq mi) |
| Population (2021)[3] | |
• Total | 8,468 |
| • Density | 78.1/km2 (202/sq mi) |
| • Pop 2016-2021 | |
| • Dwellings | 3,343 |
| Time zone | UTC−5 (EST) |
| • Summer (DST) | UTC−4 (EDT) |
| Postal code(s) | |
| Area code(s) | 418 and 581 |
| Highways | No major routes |
| Website | sbdl |
The city is named in honor of Brigid of Kildare as a recall the irish origin of the first settlers. The name Laval comes from the situation of Sainte-Brigitte in the seigneury of Beaupré, whose first owner was François de Laval, bishop of Quebec.
Demographics
edit| Year | Pop. | ±% |
|---|---|---|
| 1991 | 2,833 | — |
| 1996 | 3,214 | +13.4% |
| 2001 | 3,383 | +5.3% |
| 2006 | 3,790 | +12.0% |
| 2011 | 5,696 | +50.3% |
| 2016 | 7,348 | +29.0% |
| 2021 | 8,468 | +15.2% |
In the 2021 Census of Population conducted by Statistics Canada, Sainte-Brigitte-de-Laval had a population of 8,468 living in 3,203 of its 3,343 total private dwellings, a change of 15.2% from its 2016 population of 7,348. With a land area of 108.42 km2 (41.86 sq mi), it had a population density of 78.1/km2 (202.3/sq mi) in 2021.[5]
Mother tongue:
- French as first language: 97.1%
- English as first language: 0.8%
- English and French as first language: 0.8%
- Other as first language: 1.0%
Government
edit| Year | Liberal | Conservative | Bloc Québécois | New Democratic | Green | ||||||
|---|---|---|---|---|---|---|---|---|---|---|---|
| 2021 | 14% | 563 | 49% | 1,924 | 22% | 851 | 7% | 260 | 0% | 0 | |
| 2019 | 18% | 670 | 41% | 1,526 | 26% | 993 | 7% | 279 | 4% | 152 | |
| Year | CAQ | Liberal | QC solidaire | Parti Québécois | |||||
|---|---|---|---|---|---|---|---|---|---|
| 2018 | 55% | 2,088 | 13% | 479 | 13% | 506 | 10% | 374 | |
| 2014 | 41% | 1,506 | 35% | 1,287 | 5% | 193 | 13% | 473 | |
Sainte-Brigitte-de-Laval forms part of the federal electoral district of Portneuf—Jacques-Cartier and has been represented by Joël Godin of the Conservative Party since 2015. Provincially, Sainte-Brigitte-de-Laval is part of the Montmorency electoral district and is represented by Jean-François Simard of the Coalition Avenir Québec since 2018.
Administration
edit2022 administration:
- Mayor: France Fortier
- District #1: Simon St-Hilaire
- District #2: Guillaume Plamondon
- District #3: Benjamin Dagar-Magnan (elected in 2023 by-election)
- District #4: Mathieu Thomassin
- District #5: Charles Morissette
- District #6: Michèle Dufresne
See also
editReferences
edit- ^ "Banque de noms de lieux du Québec: Reference number 416381". toponymie.gouv.qc.ca (in French). Commission de toponymie du Québec.
- ^ a b Ministère des Affaires municipales, des Régions et de l'Occupation du territoire - Répertoire des municipalités: Sainte-Brigitte-de-Laval
- ^ a b Statistics Canada 2021 Census - Sainte-Brigitte-de-Laval census profile
- ^ Statistics Canada: 1996, 2001, 2006, 2011, 2016, 2021 census
- ^ "Population and dwelling counts: Canada, provinces and territories, and census subdivisions (municipalities), Quebec". Statistics Canada. February 9, 2022. Retrieved August 29, 2022.
- ^ "Official Voting Results Raw Data (poll by poll results in Sainte-Brigitte-de-Laval)". Elections Canada. 7 April 2022. Retrieved March 3, 2023.
- ^ "Official Voting Results by polling station (poll by poll results in Sainte-Brigitte-de-Laval)". Elections Québec. Retrieved March 4, 2023.
External links
editMedia related to Sainte-Brigitte-de-Laval at Wikimedia Commons

