1844 United States presidential election in Alabama
(Redirected from United States presidential election in Alabama, 1844)
The 1844 United States presidential election in Alabama took place between November 1 and December 4, 1844, as part of the 1844 United States presidential election. Voters chose nine representatives, or electors to the Electoral College, who voted for President and Vice President.
| ||||||||||||||||||||||||||
| ||||||||||||||||||||||||||
 County Results
| ||||||||||||||||||||||||||
| ||||||||||||||||||||||||||
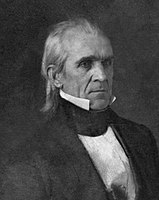
Alabama voted for the Democratic candidate, James K. Polk, over Whig candidate Henry Clay. Polk won Alabama by a margin of 17.98%.
Results
edit| Party | Candidate | Votes | % | |
|---|---|---|---|---|
| Democratic | James K. Polk | 37,401 | 58.99% | |
| Whig | Henry Clay | 26,002 | 41.01% | |
| Total votes | 63,403 | 100% | ||
Results By County
edit| County | James K. Polk
Democratic |
Henry Clay
Whig |
Total Votes Cast | ||
|---|---|---|---|---|---|
| # | % | # | % | ||
| Autauga | 633 | 57.13% | 475 | 42.87% | 1,108 |
| Baldwin | 120 | 44.61% | 149 | 55.39% | 269 |
| Barbour | 860 | 43.59% | 1,113 | 56.41% | 1,973 |
| Bibb | 1,382 | 78.75% | 373 | 21.25% | 1,755 |
| Benton | 596 | 56.98% | 450 | 43.02% | 1,046 |
| Blount | 774 | 90.21% | 84 | 9.79% | 858 |
| Butler | 405 | 37.82% | 666 | 62.18% | 1,071 |
| Chambers | 936 | 44.70% | 1,158 | 55.30% | 2,094 |
| Cherokee | 955 | 72.85% | 356 | 27.15% | 1,311 |
| Clarke | 631 | 73.12% | 232 | 26.88% | 863 |
| Coffee | 315 | 68.93% | 142 | 31.07% | 457 |
| Conecuh | 277 | 38.58% | 441 | 61.42% | 718 |
| Coosa | 796 | 66.56% | 400 | 33.44% | 1,196 |
| Covington | 139 | 48.43% | 148 | 51.57% | 287 |
| Dale | 616 | 74.67% | 209 | 25.33% | 825 |
| Dallas | 722 | 45.52% | 864 | 54.48% | 1,586 |
| DeKalb | 700 | 77.18% | 207 | 22.82% | 907 |
| Fayette | 796 | 83.88% | 153 | 16.12% | 949 |
| Franklin | 983 | 67.89% | 465 | 32.11% | 1,448 |
| Greene | 819 | 42.90% | 1,090 | 57.10% | 1,909 |
| Henry | 546 | 59.80% | 367 | 40.20% | 913 |
| Jackson | 1,751 | 95.27% | 87 | 4.73% | 1,838 |
| Jefferson | 585 | 68.90% | 264 | 31.10% | 849 |
| Lauderdale | 919 | 65.97% | 474 | 34.03% | 1,393 |
| Lawrence | 783 | 62.54% | 469 | 37.46% | 1,252 |
| Limestone | 965 | 74.81% | 325 | 25.19% | 1,290 |
| Lowndes | 678 | 48.85% | 710 | 51.15% | 1,388 |
| Macon | 626 | 36.54% | 1,087 | 63.46% | 1,713 |
| Madison | 1,720 | 82.81% | 357 | 17.19% | 2,077 |
| Marengo | 634 | 46.62% | 726 | 53.38% | 1,360 |
| Marion | 638 | 84.17% | 120 | 15.83% | 758 |
| Marshall | 875 | 84.38% | 162 | 15.62% | 1,037 |
| Mobile | 1,347 | 48.98% | 1,403 | 51.02% | 2,750 |
| Monroe | 359 | 38.77% | 567 | 61.23% | 926 |
| Montgomery | 836 | 45.14% | 1,016 | 54.86% | 1,852 |
| Morgan | 682 | 71.56% | 271 | 28.44% | 953 |
| Perry | 849 | 49.42% | 869 | 50.58% | 1,718 |
| Pickens | 967 | 52.02% | 892 | 47.98% | 1,859 |
| Pike | 768 | 47.12% | 862 | 52.88% | 1,630 |
| Randolph | 747 | 72.17% | 288 | 27.83% | 1,035 |
| Russell | 624 | 45.88% | 736 | 54.12% | 1,360 |
| Shelby | 472 | 48.02% | 511 | 51.98% | 983 |
| St. Clair | 644 | 93.33% | 46 | 6.67% | 690 |
| Sumter | 1,061 | 53.37% | 927 | 46.63% | 1,988 |
| Talladega | 851 | 57.35% | 633 | 42.65% | 1,484 |
| Tallapoosa | 705 | 49.20% | 728 | 50.80% | 1,433 |
| Tuscaloosa | 964 | 51.66% | 902 | 48.34% | 1,866 |
| Walker | 442 | 72.22% | 170 | 27.78% | 612 |
| Washington | 279 | 50.54% | 273 | 49.46% | 552 |
| Wilcox | 629 | 51.81% | 585 | 48.19% | 1,214 |
| Totals | 37,401 | 58.99% | 26,002 | 41.01% | 63,403 |
See also
editReferences
edit- ^ "1844 Presidential General Election Results - Alabama". U.S. Election Atlas. Retrieved December 23, 2013.
- ^ Dubin, Michael J. United States Presidential Elections. 1788-1870: The Official Results by County and State. ISBN 978-0-7864-6422-7.

