2000 United States presidential election in Washington (state)
The 2000 United States presidential election in Washington took place on November 7, 2000, and was part of the 2000 United States presidential election. Voters chose 11 representatives, or electors to the Electoral College, who voted for president and vice president.
| ||||||||||||||||||||||||||
| Turnout | 75.46% ( | |||||||||||||||||||||||||
|---|---|---|---|---|---|---|---|---|---|---|---|---|---|---|---|---|---|---|---|---|---|---|---|---|---|---|
| ||||||||||||||||||||||||||
 County Results
| ||||||||||||||||||||||||||
| ||||||||||||||||||||||||||
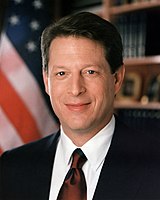
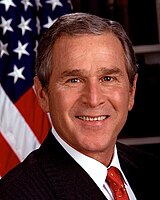
The State of Washington was considered a competitive swing state in 2000, and both campaigns sent advertisements into the state.[2][3] On election day, Gore won the state with a margin of 5.6%. Gore's best performance in the state was in King County, also the largest populated county, which he won with 60% of the vote. As of the 2024 presidential election[update], this is the last election in which Whatcom County voted for the Republican candidate.
Results
edit| 2000 United States presidential election in Washington (state) | |||||
|---|---|---|---|---|---|
| Party | Candidate | Votes | Percentage | Electoral votes | |
| Democratic | Albert Arnold Gore Jr. | 1,247,652 | 50.13% | 11 | |
| Republican | George Walker Bush | 1,108,864 | 44.56% | 0 | |
| Green/Progressive | Ralph Nader | 103,002 | 4.14% | 0 | |
| Libertarian | Harry Browne | 13,135 | 0.53% | 0 | |
| Reform | Pat Buchanan | 7,171 | 0.29% | 0 | |
| Natural Law | John Hagelin | 2,927 | 0.12% | 0 | |
| Constitution | Howard Phillips | 1,989 | 0.08% | 0 | |
| Workers World | Monica Moorehead | 1,729 | 0.07% | 0 | |
| - | Write Ins | 1,312 | 0.05% | 0 | |
| Socialist | David McReynolds | 660 | 0.03% | 0 | |
| Socialist Workers | James Harris | 304 | 0.01% | 0 | |
| Totals | 2,488,745 | 100.00% | 11 | ||
| Voter turnout | 59% | ||||
By county
edit| County | Al Gore Democratic |
George W. Bush Republican |
Various candidates Other parties |
Margin | Total | ||||
|---|---|---|---|---|---|---|---|---|---|
| # | % | # | % | # | % | # | % | ||
| Adams | 1,406 | 28.27% | 3,440 | 69.16% | 128 | 2.57% | -2,034 | -40.89% | 4,974 |
| Asotin | 2,736 | 34.26% | 4,909 | 61.48% | 340 | 4.26% | -2,173 | -27.22% | 7,985 |
| Benton | 19,512 | 32.64% | 38,367 | 64.18% | 1,900 | 3.18% | -18,855 | -31.54% | 59,779 |
| Chelan | 8,412 | 31.72% | 16,980 | 64.03% | 1,184 | 4.46% | -8,568 | -32.31% | 26,576 |
| Clallam | 13,779 | 42.75% | 16,251 | 50.42% | 2,202 | 6.83% | -2,472 | -7.67% | 32,232 |
| Clark | 61,767 | 45.57% | 67,219 | 49.59% | 6,558 | 4.84% | -5,452 | -4.02% | 135,544 |
| Columbia | 515 | 24.44% | 1,523 | 72.28% | 69 | 3.27% | -1,008 | -47.84% | 2,107 |
| Cowlitz | 18,233 | 49.33% | 16,873 | 45.65% | 1,856 | 5.02% | 1,360 | 3.68% | 36,962 |
| Douglas | 3,822 | 29.73% | 8,512 | 66.22% | 521 | 4.05% | -4,690 | -36.49% | 12,855 |
| Ferry | 932 | 30.68% | 1,896 | 62.41% | 210 | 6.91% | -964 | -31.73% | 3,038 |
| Franklin | 4,653 | 34.18% | 8,594 | 63.13% | 367 | 2.70% | -3,941 | -28.95% | 13,614 |
| Garfield | 300 | 22.57% | 982 | 73.89% | 47 | 3.54% | -682 | -51.32% | 1,329 |
| Grant | 7,073 | 29.72% | 15,830 | 66.52% | 895 | 3.76% | -8,757 | -36.80% | 23,798 |
| Grays Harbor | 13,304 | 51.22% | 11,225 | 43.22% | 1,443 | 5.56% | 2,079 | 8.00% | 25,972 |
| Island | 14,778 | 44.78% | 16,408 | 49.72% | 1,818 | 5.51% | -1,630 | -4.94% | 33,004 |
| Jefferson | 8,281 | 52.30% | 6,095 | 38.50% | 1,457 | 9.20% | 2,186 | 13.80% | 15,833 |
| King | 476,700 | 60.02% | 273,171 | 34.40% | 44,325 | 5.58% | 203,529 | 25.62% | 794,196 |
| Kitsap | 50,302 | 48.90% | 46,427 | 45.13% | 6,138 | 5.97% | 3,875 | 3.77% | 102,867 |
| Kittitas | 5,516 | 39.16% | 7,727 | 54.86% | 843 | 5.98% | -2,211 | -15.70% | 14,086 |
| Klickitat | 3,062 | 37.43% | 4,557 | 55.70% | 562 | 6.87% | -1,495 | -18.27% | 8,181 |
| Lewis | 9,891 | 32.99% | 18,565 | 61.91% | 1,530 | 5.10% | -8,674 | -28.92% | 29,986 |
| Lincoln | 1,417 | 27.27% | 3,546 | 68.23% | 234 | 4.50% | -2,129 | -40.96% | 5,197 |
| Mason | 10,876 | 48.38% | 10,257 | 45.63% | 1,347 | 5.99% | 619 | 2.75% | 22,480 |
| Okanogan | 4,335 | 29.29% | 9,384 | 63.41% | 1,079 | 7.29% | -5,049 | -34.12% | 14,798 |
| Pacific | 4,895 | 51.42% | 4,042 | 42.46% | 582 | 6.11% | 853 | 8.96% | 9,519 |
| Pend Oreille | 1,973 | 36.28% | 3,076 | 56.56% | 389 | 7.15% | -1,103 | -20.28% | 5,438 |
| Pierce | 138,249 | 51.41% | 118,431 | 44.04% | 12,246 | 4.55% | 19,818 | 7.37% | 268,926 |
| San Juan | 4,426 | 52.54% | 3,005 | 35.67% | 993 | 11.79% | 1,421 | 16.87% | 8,424 |
| Skagit | 20,432 | 45.18% | 22,163 | 49.01% | 2,626 | 5.81% | -1,731 | -3.83% | 45,221 |
| Skamania | 1,753 | 41.26% | 2,151 | 50.62% | 345 | 8.12% | -398 | -9.36% | 4,249 |
| Snohomish | 129,612 | 51.57% | 109,615 | 43.61% | 12,101 | 4.81% | 19,997 | 7.96% | 251,328 |
| Spokane | 74,604 | 43.35% | 89,299 | 51.88% | 8,209 | 4.77% | -14,695 | -8.53% | 172,112 |
| Stevens | 5,560 | 30.89% | 11,299 | 62.78% | 1,140 | 6.33% | -5,739 | -31.89% | 17,999 |
| Thurston | 50,467 | 51.80% | 39,924 | 40.98% | 7,031 | 7.22% | 10,543 | 10.82% | 97,422 |
| Wahkiakum | 803 | 40.70% | 1,033 | 52.36% | 137 | 6.94% | -230 | -11.66% | 1,973 |
| Walla Walla | 7,188 | 33.64% | 13,304 | 62.27% | 873 | 4.09% | -6,116 | -28.63% | 21,365 |
| Whatcom | 34,033 | 46.14% | 34,287 | 46.49% | 5,437 | 7.37% | -254 | -0.35% | 73,757 |
| Whitman | 6,509 | 40.09% | 9,003 | 55.45% | 725 | 4.47% | -2,494 | -15.36% | 16,237 |
| Yakima | 25,546 | 37.91% | 39,494 | 58.61% | 2,342 | 3.48% | -13,948 | -20.70% | 67,382 |
| Totals | 1,247,652 | 50.13% | 1,108,864 | 44.56% | 132,229 | 5.31% | 138,788 | 5.57% | 2,488,745 |
Counties that flipped from Democratic to Republican
edit- Asotin (Largest city: Clarkston)
- Clallam (Largest city: Port Angeles)
- Clark (Largest city: Vancouver)
- Ferry (Largest city: Republic)
- Klickitat (Largest city: Goldendale)
- Pend Oreille (Largest city: Newport)
- Skagit (Largest city: Mount Vernon)
- Skamania (Largest city: Carson)
- Spokane (Largest city: Spokane)
- Wahkiakum (Largest city: Puget Island)
- Whatcom (Largest city: Bellingham)
- Whitman (Largest city: Pullman)
By congressional district
editGore won 6 of 9 congressional districts. Both candidates won a district held by the other party.[4]
| District | Bush | Gore | Representative |
|---|---|---|---|
| 1st | 42% | 54% | Jay Inslee |
| 2nd | 46% | 48% | Jack Metcalf |
| Rick Larsen | |||
| 3rd | 48% | 47% | Brian Baird |
| 4th | 62% | 34% | Doc Hastings |
| 5th | 55% | 40% | George Nethercutt |
| 6th | 44% | 51% | Norman D. Dicks |
| 7th | 20% | 72% | Jim McDermott |
| 8th | 47% | 49% | Jennifer Dunn |
| 9th | 42% | 54% | Adam Smith |
Electors
edit- Rachel Lake
- Debbie Aldrich
- Paul Steinberg
- Carol Sue Perkins
- Tim Hattenburg
- Debbie Regala
- Vic Battson
- Carl Schwartz
- Nancy McGinnis
- Jim Frush
- Charlotte Coker
See also
editReferences
edit- ^ "Dave Leip's Atlas of U.S. Presidential Elections".
- ^ Marks, Peter (July 23, 2000). "July 16–22; Making Margin Calls in a Tightening Race". The New York Times.
- ^ Berke, Richard L. (August 20, 2000). "The 2000 Campaign: The Tactics; Ad Blitz to Start as Bush and Gore Define Key States". The New York Times.
- ^ "Presidential Results by Congressional District, 2000-2008 – Swing State Project".

