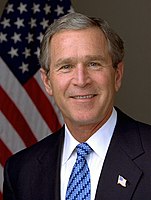
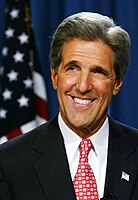
2004 United States presidential election in Wyoming
The 2004 United States presidential election in Wyoming took place on November 2, 2004, and was part of the 2004 United States presidential election. Voters chose three representatives, or electors to the Electoral College, who voted for president and vice president.
| ||||||||||||||||||||||||||
| Turnout | 104.7% (of registered voters) 64.1% (of voting age population) | |||||||||||||||||||||||||
|---|---|---|---|---|---|---|---|---|---|---|---|---|---|---|---|---|---|---|---|---|---|---|---|---|---|---|
| ||||||||||||||||||||||||||
 County results
| ||||||||||||||||||||||||||
| ||||||||||||||||||||||||||
Wyoming was won by incumbent President George W. Bush by a 39.8% margin of victory. Prior to the election, all 12 news organizations considered this a state Bush would win, or otherwise considered as a safe red state. This was based on pre-election polling, the fact that the last Democrat to win here was Lyndon B. Johnson in 1964, the presence of Wyoming native Dick Cheney on the ticket, and how Bush carried this state in 2000 with almost 68% of the vote. On election day Bush won every county with over 65% except for Teton County, which Kerry won with 53% and Albany County, which Bush won with 54% of the vote. Bush thus became the first ever Republican to win the White House without carrying Teton County.
With 68.86% of the popular vote, Wyoming would prove to be Bush's second strongest state in the 2004 election after neighboring Utah.[1]
Caucuses
editCampaign
editPredictions
editThere were 12 news organizations who made state-by-state predictions of the election. Here are their last predictions before election day.[2]
| Source | Ranking |
|---|---|
| D.C. Political Report | Solid R |
| Associated Press | Solid R |
| CNN | Likely R |
| Cook Political Report | Solid R |
| Newsweek | Solid R |
| New York Times | Solid R |
| Rasmussen Reports | Likely R |
| Research 2000 | Solid R |
| Washington Post | Likely R |
| Washington Times | Solid R |
| Zogby International | Likely R |
| Washington Dispatch | Likely R |
Polling
editOnly one pre-election poll was conducted. It showed Bush leading Kerry 65% to 29%.[3]
Fundraising
editBush raised $531,380.[4] Kerry raised $466,535.[5]
Advertising and visits
editNeither campaign advertised or visited this state during the fall campaign.[6][7]
Analysis
editWyoming is a Republican bastion. The last Democrat to win a senate election was Gale W. McGee in 1970. The last Democrat to win the at-large House seat was Teno Roncalio in 1976. The last time the Democrats controlled the Wyoming House of Representatives was 1966. The last time Democrats controlled the Wyoming Senate was 1938. The state, however, did continuously have Democratic governors from 1975 to 2011 with only an eight-year interruption of Jim Geringer's tenure from 1995 to 2003.
In presidential elections, Wyoming is one of the most reliable red states in the country. The last Democrat to carry the state, or even crack the 40% mark, was LBJ in 1964, and before that was Harry S. Truman in 1948. Since 1968, every Republican carried this state by a double-digit margin of victory, except in 1992. As far as popular vote percentage, the 2004 results were the third best performance by the Republican party since 1964, behind only Richard Nixon (69.0%) in 1972 and Ronald Reagan (70.5%) in 1984. With regards to the margin of victory, the 2004 election (at 39.8%) was also the third best performance, behind only George W. Bush (40.1%) in 2000 and Ronald Reagan (42.3%) in 1984.
CNN exit polls showed 72% of the state approved of Bush, and 69% approved of his decision to go to war.[8]
Results
edit| 2004 United States presidential election in Wyoming[9] | ||||||
|---|---|---|---|---|---|---|
| Party | Candidate | Running mate | Votes | Percentage | Electoral votes | |
| Republican | George W. Bush (Inc.) | Dick Cheney (incumbent) | 167,629 | 68.86% | 3 | |
| Democratic | John Kerry | John Edwards | 70,776 | 29.07% | 0 | |
| Independent | Ralph Nader | Peter Camejo | 2,741 | 1.13% | 0 | |
| Libertarian | Michael Badnarik | Richard Campagna | 1,171 | 0.48% | 0 | |
| Independent | Michael Peroutka | Chuck Baldwin | 631 | 0.26% | 0 | |
| Write Ins | 480 | 0.20% | 0 | |||
| Totals | 243,428 | 100.00% | 3 | |||
| Voter turnout (Voting age population) | 64.1% | |||||
By county
edit| County | George W. Bush Republican |
John Kerry Democratic |
Various candidates Other parties |
Margin | Total votes cast | ||||
|---|---|---|---|---|---|---|---|---|---|
| # | % | # | % | # | % | # | % | ||
| Albany | 9,006 | 54.17% | 7,117 | 42.81% | 501 | 3.01% | 1,889 | 11.36% | 16,624 |
| Big Horn | 4,232 | 80.11% | 960 | 18.17% | 91 | 1.72% | 3,272 | 61.94% | 5,283 |
| Campbell | 12,415 | 82.22% | 2,464 | 16.32% | 220 | 1.46% | 9,951 | 65.90% | 15,099 |
| Carbon | 4,758 | 67.23% | 2,158 | 30.49% | 161 | 2.27% | 2,600 | 36.74% | 7,077 |
| Converse | 4,447 | 77.68% | 1,184 | 20.68% | 94 | 1.64% | 3,263 | 57.00% | 5,725 |
| Crook | 2,836 | 83.51% | 501 | 14.75% | 59 | 1.74% | 2,335 | 68.76% | 3,396 |
| Fremont | 11,429 | 66.85% | 5,338 | 31.22% | 329 | 1.92% | 6,091 | 35.63% | 17,096 |
| Goshen | 4,114 | 71.19% | 1,566 | 27.10% | 99 | 1.71% | 2,548 | 44.09% | 5,779 |
| Hot Springs | 1,812 | 73.06% | 623 | 25.12% | 45 | 1.81% | 1,189 | 47.94% | 2,480 |
| Johnson | 3,231 | 80.96% | 676 | 16.94% | 84 | 2.10% | 2,555 | 64.02% | 3,991 |
| Laramie | 25,951 | 65.07% | 13,171 | 33.03% | 757 | 1.90% | 12,780 | 32.04% | 39,879 |
| Lincoln | 6,423 | 81.16% | 1,364 | 17.24% | 127 | 1.60% | 5,059 | 63.92% | 7,914 |
| Natrona | 21,512 | 67.08% | 9,863 | 30.76% | 693 | 2.16% | 11,649 | 36.32% | 32,068 |
| Niobrara | 1,064 | 80.97% | 230 | 17.50% | 20 | 1.52% | 834 | 63.47% | 1,314 |
| Park | 10,917 | 76.71% | 3,007 | 21.13% | 307 | 2.16% | 7,910 | 55.58% | 14,231 |
| Platte | 3,149 | 68.85% | 1,328 | 29.03% | 97 | 2.12% | 1,821 | 39.82% | 4,574 |
| Sheridan | 9,689 | 69.06% | 4,066 | 28.98% | 274 | 1.95% | 5,623 | 40.08% | 14,029 |
| Sublette | 2,847 | 77.98% | 730 | 19.99% | 74 | 2.03% | 2,117 | 57.99% | 3,651 |
| Sweetwater | 10,653 | 65.47% | 5,208 | 32.01% | 411 | 2.53% | 5,445 | 33.46% | 16,272 |
| Teton | 5,124 | 45.11% | 5,972 | 52.58% | 263 | 2.32% | -848 | -7.47% | 11,359 |
| Uinta | 6,081 | 75.25% | 1,815 | 22.46% | 185 | 2.29% | 4,266 | 52.79% | 8,081 |
| Washakie | 3,200 | 77.78% | 855 | 20.78% | 59 | 1.43% | 2,345 | 57.00% | 4,114 |
| Weston | 2,739 | 80.75% | 580 | 17.10% | 73 | 2.15% | 2,159 | 63.65% | 3,392 |
| Total | 167,629 | 68.86% | 70,776 | 29.07% | 5,023 | 2.06% | 96,853 | 39.79% | 243,428 |
Counties that flipped from Republican to Democratic
editBy congressional district
editDue to the state's low population, only one congressional district is allocated. This district, called the At-Large district, because it covers the entire state, and thus is equivalent to the statewide election results.
| District | Bush | Kerry | Representative |
|---|---|---|---|
| At-large | 68.9% | 29.1% | Barbara Cubin |
Electors
editTechnically the voters of Wyoming cast their ballots for electors: representatives to the Electoral College. Wyoming is allocated three electors because it has one congressional districts and two senators. All candidates who appear on the ballot or qualify to receive write-in votes must submit a list of three electors, who pledge to vote for their candidate and his or her running mate. Whoever wins the majority of votes in the state is awarded all three electoral votes. Their chosen electors then vote for president and vice president. Although electors are pledged to their candidate and running mate, they are not obligated to vote for them. An elector who votes for someone other than his or her candidate is known as a faithless elector.
The electors of each state and the District of Columbia met on December 13, 2004, to cast their votes for president and vice president. The Electoral College itself never meets as one body. Instead the electors from each state and the District of Columbia met in their respective capitols.
The following were the members of the Electoral College from the state. All three were pledged for Bush/Cheney.[10]
- Linda Barker
- Jack Van Mark
- Mike Baker
See also
editReferences
edit- ^ "2004 Presidential Election Statistics". Dave Leip's Atlas of U.S. Presidential Elections. Retrieved March 5, 2018.
- ^ "Archived copy". dcpoliticalreport.com. Archived from the original on November 21, 2010. Retrieved January 17, 2022.
{{cite web}}: CS1 maint: archived copy as title (link) - ^ "Election 2004 Polls - Dave Leip's Atlas of U.S. Presidential Elections". Archived from the original on November 28, 2008. Retrieved October 23, 2009.
- ^ "George W Bush - $374,659,453 raised, '04 election cycle, Republican Party, President". www.campaignmoney.com.
- ^ "John F Kerry - $345,826,176 raised, '04 election cycle, Democratic Party, President". www.campaignmoney.com.
- ^ "CNN.com Specials". www.cnn.com.
- ^ "CNN.com Specials". www.cnn.com.
- ^ "CNN.com Election 2004". www.cnn.com.
- ^ "CNN.com Election 2004". www.cnn.com.
- ^ "Wyoming Secretary of State". Archived from the original on November 30, 2008. Retrieved October 23, 2009.

