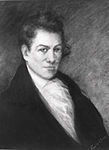
The 1821 Alabama gubernatorial election was held on August 6, 1821, to elect the third governor of Alabama. Democratic-Republican candidate Israel Pickens defeated fellow Democratic-Republican candidate Henry H. Chambers with 57.43% of the vote.
| |||||||||||||||||
| |||||||||||||||||
 County results Pickens: 50–60% 60–70% 70–80% 80–90% >90% Chambers: 50–60% 60–70% 80–90% Unknown/No Vote: | |||||||||||||||||
| |||||||||||||||||
General election
editCandidates
edit- Israel Pickens, US Representative for North Carolina 1811-1817
- Henry H. Chambers, Delegate to the Alabama Constitutional Convention and Alabama House member in 1820
Results
edit| Party | Candidate | Votes | % | ±% | |
|---|---|---|---|---|---|
| Democratic-Republican | Israel Pickens | 9,616 | 57.43% | ||
| Democratic-Republican | Henry H. Chambers | 7,129 | 42.57% | ||
| Majority | 2,487 | 14.85% | |||
| Turnout | 16,745 | ||||
County Results
edit| County | Israel Pickens
Democratic-Republican |
Henry Chambers
Democratic-Republican |
Total votes | ||
|---|---|---|---|---|---|
| # | % | # | % | ||
| Autagua | 330 | 64.1% | 185 | 35.9% | 515 |
| Baldwin | 98 | 51.5% | 96 | 48.5% | 194 |
| Bibb | 215 | 42.8% | 287 | 57.2% | 502 |
| Blount & Jefferson | 510 | 47.4% | 566 | 52.6% | 1,076 |
| Butler & Conecuh | 569 | 93.6% | 39 | 6.4% | 608 |
| Clarke | 569 | 93.1% | 42 | 6.9% | 611 |
| Dallas | 454 | 53.6% | 393 | 46.4% | 847 |
| Franklin | 329 | 56.5% | 253 | 43.5% | 612 |
| Greene & Marengo | 713 | 89.2% | 86 | 10.8% | 799 |
| Jackson | 392 | 38.5% | 625 | 61.5% | 1,017 |
| Lauderdale | 308 | 54.4% | 258 | 45.6% | 566 |
| Lawrence | 516 | 51.8% | 481 | 48.2% | 997 |
| Limestone | 169 | 16.0% | 886 | 84.0% | 1,055 |
| Madison | 948 | 44.8% | 1,168 | 55.2% | 2,116 |
| Marion | 158 | 90.8% | 16 | 9.2% | 174 |
| Mobile | 89 | 48.9% | 93 | 51.1% | 182 |
| Monroe | 931 | 89.8% | 106 | 10.2% | 1,037 |
| Montgomery | 531 | 71.1% | 216 | 28.9% | 747 |
| Morgan | 408 | 52.7% | 316 | 47.3% | 724 |
| Perry | 314 | 84.9% | 56 | 15.1% | 370 |
| St. Clair | 359 | 68.5% | 165 | 31.5% | 524 |
| Shelby | 59 | 19.0% | 251 | 81.0% | 310 |
| Tuscaloosa | 716 | 65.5% | 377 | 34.5% | 1,093 |
| Washington | 245 | 52.5% | 222 | 47.5% | 467 |
| Totals[a] | 9,616 | 57.4% | 7,129 | 42.6% | 16,745 |
Notes
editReferences
edit- ^ a b Dubin, Michael J. (2003). United States Gubernatorial Elections, 1776-1860: The Official Results by State and County. Jefferson: McFarland & Company. p. 1. ISBN 9780786414390.

