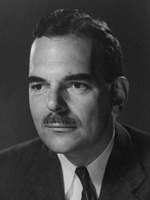
The 1944 United States presidential election in Maryland took place on November 7, 1944, as part of the 1944 United States presidential election. State voters chose eight[2] representatives, or electors, to the Electoral College, who voted for president and vice president.
| ||||||||||||||||||||||||||
All 8 Maryland votes to the Electoral College | ||||||||||||||||||||||||||
|---|---|---|---|---|---|---|---|---|---|---|---|---|---|---|---|---|---|---|---|---|---|---|---|---|---|---|
| ||||||||||||||||||||||||||
 County Results
| ||||||||||||||||||||||||||
| ||||||||||||||||||||||||||
Maryland was won by incumbent President Franklin D. Roosevelt (D–New York), running with Senator Harry S. Truman, with 51.85% of the popular vote, against Governor Thomas E. Dewey (R–New York), running with Governor John Bricker, with 48.15% of the popular vote.[3][4]
In this election, Maryland voted 3.79% to the right of the nation at-large.[5]
Results
edit| Party | Candidate | Votes | % | |
|---|---|---|---|---|
| Democratic | Franklin D. Roosevelt (inc.) | 315,490 | 51.85% | |
| Republican | Thomas E. Dewey | 292,949 | 48.15% | |
| Total votes | 608,439 | 100% | ||
Results by county
edit| County | Franklin Delano Roosevelt Democratic |
Thomas Edmund Dewey Republican |
Margin | Total votes cast[6] | |||
|---|---|---|---|---|---|---|---|
| # | % | # | % | # | % | ||
| Allegany | 15,345 | 49.61% | 15,589 | 50.39% | -244 | -0.79% | 30,934 |
| Anne Arundel | 10,269 | 48.60% | 10,860 | 51.40% | -591 | -2.80% | 21,129 |
| Baltimore | 26,275 | 43.56% | 34,047 | 56.44% | -7,772 | -12.88% | 60,322 |
| Baltimore City | 163,493 | 59.17% | 112,817 | 40.83% | 50,676 | 18.34% | 276,310 |
| Calvert | 1,549 | 41.49% | 2,184 | 58.51% | -635 | -17.01% | 3,733 |
| Caroline | 2,060 | 40.13% | 3,073 | 59.87% | -1,013 | -19.74% | 5,133 |
| Carroll | 4,483 | 33.25% | 8,999 | 66.75% | -4,516 | -33.50% | 13,482 |
| Cecil | 4,662 | 55.89% | 3,680 | 44.11% | 982 | 11.77% | 8,342 |
| Charles | 1,875 | 40.50% | 2,755 | 59.50% | -880 | -19.01% | 4,630 |
| Dorchester | 4,764 | 52.90% | 4,241 | 47.10% | 523 | 5.81% | 9,005 |
| Frederick | 8,528 | 42.87% | 11,367 | 57.13% | -2,839 | -14.27% | 19,895 |
| Garrett | 1,961 | 32.03% | 4,162 | 67.97% | -2,201 | -35.95% | 6,123 |
| Harford | 4,839 | 41.75% | 6,751 | 58.25% | -1,912 | -16.50% | 11,590 |
| Howard | 3,140 | 48.43% | 3,344 | 51.57% | -204 | -3.15% | 6,484 |
| Kent | 2,454 | 51.07% | 2,351 | 48.93% | 103 | 2.14% | 4,805 |
| Montgomery | 15,324 | 42.90% | 20,400 | 57.10% | -5,076 | -14.21% | 35,724 |
| Prince George's | 14,006 | 50.46% | 13,750 | 49.54% | 256 | 0.92% | 27,756 |
| Queen Anne's | 3,027 | 58.82% | 2,119 | 41.18% | 908 | 17.64% | 5,146 |
| Somerset | 3,125 | 45.19% | 3,790 | 54.81% | -665 | -9.62% | 6,915 |
| St. Mary's | 1,891 | 41.43% | 2,673 | 58.57% | -782 | -17.13% | 4,564 |
| Talbot | 2,768 | 42.72% | 3,712 | 57.28% | -944 | -14.57% | 6,480 |
| Washington | 11,365 | 48.17% | 12,227 | 51.83% | -862 | -3.65% | 23,592 |
| Wicomico | 5,674 | 52.96% | 5,040 | 47.04% | 634 | 5.92% | 10,714 |
| Worcester | 2,613 | 46.40% | 3,018 | 53.60% | -405 | -7.19% | 5,631 |
| Totals | 315,490 | 51.85% | 292,949 | 48.15% | 22,541 | 3.70% | 608,439 |
Counties that flipped from Democratic to Republican
editSee also
editReferences
edit- ^ "United States Presidential election of 1944 - Encyclopædia Britannica". Retrieved July 19, 2018.
- ^ "1944 Election for the Fortieth Term (1945-49)". Retrieved July 19, 2018.
- ^ "1944 Presidential General Election Results – Maryland". Retrieved July 19, 2018.
- ^ "The American Presidency Project - Election of 1944". Retrieved July 19, 2018.
- ^ "Dave Leip's Atlas of U.S. Presidential Elections". uselectionatlas.org. Retrieved March 31, 2023.
- ^ Géoelections; 1944 Presidential Election Popular Vote (.xlsx file for €15)

