This article includes a list of general references, but it lacks sufficient corresponding inline citations. (October 2024) |
The 1951 United Kingdom general election was held on Thursday 25 October 1951 to elect 625 members of the House of Commons, of which 506 constituencies were in England.
| |||||||||||||||||||||||||||||||||||||||||||||
All 506 English seats in the House of Commons 254 seats needed for English majority | |||||||||||||||||||||||||||||||||||||||||||||
|---|---|---|---|---|---|---|---|---|---|---|---|---|---|---|---|---|---|---|---|---|---|---|---|---|---|---|---|---|---|---|---|---|---|---|---|---|---|---|---|---|---|---|---|---|---|
| |||||||||||||||||||||||||||||||||||||||||||||
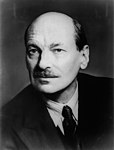
The Labour Government led by incumbent prime minister Clement Attlee decided to call an election just over one and half years after the previous election in February 1950, primarily because the Labour Party had won a mere majority of 5 seats in the House of Commons. In that election, the Labour Party had won less seats than the Conservative Party in the region of England despite winning a greater share of the vote.
The election produced an interesting anomaly in England as well as the nation at large - despite the Labour Party winning a greater share of the vote, the Conservative Party won an overall majority, both in the Commons and in England. This occurrence would next take place only in 2005 when the Labour Party would a win a majority of seats in England while the Conservative Party would accumulate a grater share of the vote (however, the Labour Party won a greater share of the vote than the Conservatives in the nation as a whole). This election also noted the highest ever voteshare as well as the total number of votes the Labour Party has ever recorded in any election in England as well as the nation at whole.[1]
The narrow victory of the Conservative Party led to the return of Winston Churchill as prime minister and the start of 13 years of Conservative rule (the second longest period of one-party rule in the 20th century).
Result Table
edit| Party | Seats won | Net change in seats | Total votes (in millions) | Voteshare | Change in voteshare |
|---|---|---|---|---|---|
| Conservative | 271 | 18 | 11.62 | 48.76% | 4.92% |
| Labour | 233 | 18 | 11.63 | 48.80% | 2.67% |
| Liberal | 2 | 0.57 | 2.26% | 7.13% |
References
edit- ^ Harmer, Emily (2021). Women, media, and elections: representation and marginalization in British politics. Bristol: Bristol University Press. ISBN 978-1-5292-0494-0.
Further reading
edit- Thorpe, Andrew (1997). A History of the British Labour Party. London: Macmillan Education UK.
- Jenkin, Thomas P. (1952). "The British General Election of 1951". The Western Political Quarterly. 5 (1): 51–65
- Butler, David E. (1952), The British General Election of 1951, London: Macmillan
- Craig, F.W.S., 1975. The General Election of 1951. In British General Election Manifestos 1900–1974 (pp. 168–180). London: Palgrave Macmillan UK.


