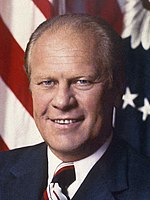
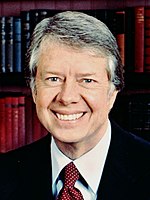
The 1976 United States presidential election in Nevada took place on November 2, 1976, as part of the 1976 United States presidential election. Voters chose three representatives, or electors, to the Electoral College, who voted for president and vice president.
| ||||||||||||||||||||||||||
| ||||||||||||||||||||||||||
 County Results
| ||||||||||||||||||||||||||
| ||||||||||||||||||||||||||
Nevada was coming off a landslide win by incumbent Mike O'Callaghan in the 1974 gubernatorial election over a severely divided opposition[1] and anger over the Watergate scandal.[2][3] However, veteran Democratic Senator Alan Bible, who had survived Richard Nixon’s 1968 victory, retired and was replaced by Republican Paul Laxalt who won a narrow victory at the same time the GOP were suffering landslide losses in other races.
This presidential election saw Nevada hold its first ever presidential primary, won by California Governor Jerry Brown,[4] who had only entered the primaries two weeks beforehand after most were already conducted.[5]
Senator Paul Laxalt, who had supported Ford's rival Ronald Reagan in the Republican primaries earlier in 1976, nonetheless campaigned vigorously for Ford once he won the GOP nomination.[6] Consequently, despite the state having not voted against a winning Democratic nominee since 1892 and not for a losing Republican nominee since James G. Blaine in 1884, early October polls gave the state provisionally to Ford, with the lack of familiarity with Southern Evangelical Carter being viewed as a critical factor.[7] Two days before Nevada's voters were to enter the polls Ford remained a slight favorite.[6]
Nevada was won by incumbent President Gerald Ford (R–Michigan), with 50.17% of the popular vote, against Jimmy Carter (D–Georgia), with 45.81% of the popular vote. None of the third-party candidates amounted to a significant portion of the vote, as 2.53% of the voters either wrote-in another candidate or selected "None of These Candidates", the latter of which appeared on Nevada's ballot for the first time in 1976.
Nevada has generally been a bellwether state since the early 20th century, and this election marked the first time since 1908 whereby Nevada was carried by the losing presidential candidate. It was the only time between 1912 and 2012. Nevada would vote for the winning candidate in each election afterward except 2016. As of the 2024 presidential election[update], this is the last time in which a Democrat has won the White House without carrying Nevada, as well as the last time that Nye County, Storey County,[a] and Esmeralda County voted for a Democratic presidential candidate.[8] This also marks the last time that Nevada voted for a candidate that lost both the electoral college and the popular vote. For the first time, Clark County, home to Las Vegas, cast over 50% of the statewide vote, which it would do in every presidential election since.
Results
edit| Party | Candidate | Votes | % | |
|---|---|---|---|---|
| Republican | Gerald Ford (inc.) | 101,273 | 50.17% | |
| Democratic | Jimmy Carter | 92,479 | 45.81% | |
| None of These Candidates | 5,108 | 2.53% | ||
| Libertarian | Roger MacBride | 1,519 | 0.75% | |
| American Independent | Lester Maddox | 1,497 | 0.74% | |
| Total votes | 201,876 | 100% | ||
Results by county
edit| County | Gerald Ford Republican |
Jimmy Carter Democratic |
None of These Candidates |
Roger MacBride Libertarian |
Lester Maddox American Independent |
Margin | Total votes cast[9] | ||||||
|---|---|---|---|---|---|---|---|---|---|---|---|---|---|
| # | % | # | % | # | % | # | % | # | % | # | % | ||
| Carson City | 5,282 | 54.11% | 3,874 | 39.69% | 367 | 3.76% | 155 | 1.59% | 83 | 0.85% | 1,408 | 14.42% | 9,761 |
| Churchill | 2,358 | 53.04% | 1,800 | 40.49% | 178 | 4.00% | 33 | 0.74% | 77 | 1.73% | 558 | 12.55% | 4,446 |
| Clark | 48,236 | 46.92% | 51,178 | 49.78% | 2,015 | 1.96% | 731 | 0.71% | 652 | 0.63% | -2,942 | -2.86% | 102,812 |
| Douglas | 3,095 | 58.60% | 1,934 | 36.61% | 162 | 3.07% | 46 | 0.87% | 45 | 0.85% | 1,161 | 21.99% | 5,282 |
| Elko | 3,293 | 60.32% | 1,955 | 35.81% | 103 | 1.89% | 40 | 0.73% | 68 | 1.25% | 1,338 | 24.51% | 5,459 |
| Esmeralda | 181 | 43.51% | 214 | 51.44% | 9 | 2.16% | 3 | 0.72% | 9 | 2.16% | -33 | -7.93% | 416 |
| Eureka | 272 | 58.24% | 163 | 34.90% | 21 | 4.50% | 5 | 1.07% | 6 | 1.28% | 109 | 23.34% | 467 |
| Humboldt | 1,380 | 53.38% | 1,074 | 41.55% | 88 | 3.40% | 14 | 0.54% | 29 | 1.12% | 306 | 11.83% | 2,585 |
| Lander | 561 | 49.96% | 518 | 46.13% | 21 | 1.87% | 8 | 0.71% | 15 | 1.34% | 43 | 3.83% | 1,123 |
| Lincoln | 700 | 50.04% | 642 | 45.89% | 34 | 2.43% | 10 | 0.71% | 13 | 0.93% | 58 | 4.15% | 1,399 |
| Lyon | 2,068 | 49.69% | 1,866 | 44.83% | 155 | 3.72% | 27 | 0.65% | 46 | 1.11% | 202 | 4.86% | 4,162 |
| Mineral | 1,104 | 42.56% | 1,361 | 52.47% | 92 | 3.55% | 8 | 0.31% | 29 | 1.12% | -257 | -9.91% | 2,594 |
| Nye | 1,027 | 42.53% | 1,261 | 52.22% | 84 | 3.48% | 18 | 0.75% | 25 | 1.04% | -234 | -9.69% | 2,415 |
| Pershing | 635 | 46.93% | 633 | 46.78% | 59 | 4.36% | 13 | 0.96% | 13 | 0.96% | 2 | 0.15% | 1,353 |
| Storey | 274 | 43.08% | 310 | 48.74% | 30 | 4.72% | 17 | 2.67% | 5 | 0.79% | -36 | -5.66% | 636 |
| Washoe | 29,264 | 54.98% | 21,687 | 40.74% | 1,599 | 3.00% | 374 | 0.70% | 303 | 0.57% | 7,577 | 14.24% | 53,227 |
| White Pine | 1,543 | 41.27% | 2,009 | 53.73% | 91 | 2.43% | 17 | 0.45% | 79 | 2.11% | -466 | -12.46% | 3,739 |
| Totals | 101,273 | 50.17% | 92,479 | 45.81% | 5,108 | 2.53% | 1,519 | 0.75% | 1,497 | 0.74% | 8,794 | 4.36% | 201,876 |
Counties that flipped from Republican to Democratic
editSee also
editNotes
edit- ^ Storey County did give a plurality to Independent Ross Perot in 1992.
References
edit- ^ Malcolm, Andrew H.; ‘Woman, 39, Wins the Republican Primary for Governor in Nevada: G. O. P. House Winner’; The New York Times, September 5, 1974, p. 27
- ^ Broder, David S.; ‘Nationwide Sweep Nets 6 Governors, Over 30 in House: Democrats Solidify Control Of Congress, State Capitols’; The Washington Post, November 6, 1974, p. A1
- ^ Broder, David; ‘Democrats savor nationwide gains: Albert calls vote a mandate’; The Boston Globe, November 7, 1974, p. 1
- ^ Winchester, Simon; ‘Jimmy Carter takes a tumble on his trip to Wild West’; The Guardian, 27 May 1976, p. 2
- ^ ‘Jerry-Come-Lately’, The New York Times, May 11, 1976, p. 32
- ^ a b ‘The West’; The Boston Globe, October 31, 1976, p. 48
- ^ ‘State by State:: A Nationwide Survey’; The Washington Post, October 3, 1976, p. 36
- ^ Sullivan, Robert David; ‘How the Red and Blue Map Evolved Over the Past Century’; America Magazine in The National Catholic Review; June 29, 2016
- ^ a b "1976 Primary and General Election Results". Nevada Secretary of State. Retrieved July 9, 2024.

