The 2004 United States presidential election in North Dakota took place on November 2, 2004, and was part of the 2004 United States presidential election. Voters chose three representatives, or electors to the Electoral College, who voted for president and vice president.
| ||||||||||||||||||||||||||
| ||||||||||||||||||||||||||
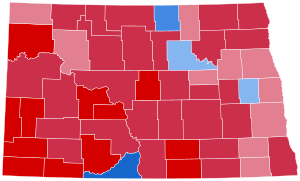
 County Results
| ||||||||||||||||||||||||||
| ||||||||||||||||||||||||||
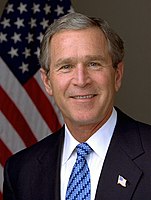
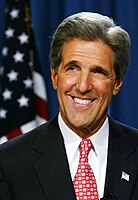
North Dakota was won by incumbent President George W. Bush by a 27.36% margin of victory. Prior to the election, all 12 news organizations considered this a state Bush would win, or otherwise considered as a safe red state. The state has voted Republican in all but five presidential elections since statehood. In 2004, George W. Bush defeated John Kerry with 62.86% of the vote, ven as incumbent Democratic Senator Byron Dorgan overwhelmingly won re-election to the senate on the same ballot. The state's population of about 650,000 is little changed from what it was 80 years ago, as North Dakota is one of seven states with the minimum of three electoral votes.
Caucuses
editCampaign
editPredictions
editThere were 12 news organizations who made state-by-state predictions of the election. Here are their last predictions before election day.[1]
| Source | Ranking |
|---|---|
| D.C. Political Report | Solid R |
| Cook Political Report | Solid R |
| Research 2000 | Solid R |
| Zogby International | Likely R |
| Washington Post | Likely R |
| Washington Dispatch | Likely R |
| Washington Times | Solid R |
| The New York Times | Solid R |
| CNN | Likely R |
| Newsweek | Solid R |
| Associated Press | Solid R |
| Rasmussen Reports | Likely R |
Polling
editBush won both pre-election polls with a double-digit margin.[2]
Fundraising
editBush raised $135,493.[3] Kerry raised $36,600.[4]
Advertising and visits
editNeither campaign visited or advertised in this state during the fall campaign.[5][6]
Analysis
editIn 2000, Al Gore won two counties, compared to Kerry who won four counties in the state, including his best performance in Sioux County, where he won with seventy percent of the vote. Overall, Bush dominated the state, winning a wide majority of the state's counties, and with large margins. In just two counties – both majority Native American – did Bush obtain less than 44 percent of the vote.[7] As of 2020, this is the last election in which the Republican nominee won Cass County by majority.
Results
edit| Party | Candidate | Votes | % | ±% | |
|---|---|---|---|---|---|
| Republican | George W. Bush (incumbent) | 196,651 | 62.86% | ||
| Democratic–NPL | John Kerry | 111,052 | 35.50% | ||
| Independent | Ralph Nader | 3,756 | 1.20% | ||
| Libertarian | Michael Badnarik | 851 | 0.27% | ||
| Constitution | Michael Peroutka | 514 | 0.16% | ||
| Write In | - | 9 | 0.0% | ||
| Majority | |||||
| Turnout | 312,833 | 64.2% | |||
Results by county
edit| County[9] | George W. Bush Republican |
John Kerry Democratic-NPL |
Ralph Nader Independent |
Michael Badnarik Libertarian |
Michael Peroutka Constitution |
Margin | Total votes cast | ||||||
|---|---|---|---|---|---|---|---|---|---|---|---|---|---|
| # | % | # | % | # | % | # | % | # | % | # | % | ||
| Adams | 915 | 70.88% | 353 | 27.34% | 15 | 1.16% | 3 | 0.23% | 5 | 0.39% | 562 | 43.54% | 1,291 |
| Barnes | 3,541 | 60.92% | 2,186 | 37.61% | 64 | 1.10% | 9 | 0.15% | 13 | 0.22% | 1,355 | 23.31% | 5,813 |
| Benson | 1,002 | 44.61% | 1,196 | 53.25% | 26 | 1.16% | 15 | 0.67% | 7 | 0.31% | -194 | -8.64% | 2,246 |
| Billings | 449 | 79.61% | 99 | 17.55% | 9 | 1.60% | 1 | 0.18% | 6 | 1.06% | 350 | 62.06% | 564 |
| Bottineau | 2,468 | 67.17% | 1,168 | 31.79% | 33 | 0.90% | 3 | 0.08% | 2 | 0.05% | 1,300 | 35.38% | 3,674 |
| Bowman | 1,280 | 74.59% | 397 | 23.14% | 29 | 1.69% | 3 | 0.17% | 6 | 0.35% | 883 | 51.45% | 1,716[a] |
| Burke | 808 | 69.36% | 336 | 28.84% | 13 | 1.12% | 5 | 0.43% | 3 | 0.26% | 472 | 40.52% | 1,165 |
| Burleigh | 26,577 | 68.47% | 11,621 | 29.94% | 489 | 1.26% | 78 | 0.20% | 48 | 0.12% | 14,956 | 38.53% | 38,814[a] |
| Cass | 39,619 | 59.39% | 26,010 | 38.99% | 732 | 1.10% | 234 | 0.35% | 112 | 0.17% | 13,609 | 20.40% | 66,711[b] |
| Cavalier | 1,522 | 62.27% | 887 | 36.29% | 29 | 1.19% | 1 | 0.04% | 5 | 0.20% | 635 | 25.98% | 2,444 |
| Dickey | 1,890 | 67.00% | 883 | 31.30% | 34 | 1.21% | 7 | 0.25% | 7 | 0.25% | 1,007 | 35.70% | 2,821 |
| Divide | 751 | 59.23% | 487 | 38.41% | 26 | 2.05% | 3 | 0.24% | 1 | 0.08% | 264 | 20.82% | 1,268 |
| Dunn | 1,178 | 66.40% | 571 | 32.19% | 16 | 0.90% | 2 | 0.11% | 7 | 0.39% | 607 | 34.21% | 1,774 |
| Eddy | 655 | 54.00% | 534 | 44.02% | 18 | 1.48% | 1 | 0.08% | 5 | 0.41% | 121 | 9.98% | 1,213 |
| Emmons | 1,449 | 68.58% | 611 | 28.92% | 43 | 2.04% | 9 | 0.43% | 1 | 0.05% | 838 | 39.66% | 2,113 |
| Foster | 1,219 | 69.03% | 518 | 29.33% | 20 | 1.13% | 6 | 0.34% | 3 | 0.17% | 701 | 39.70% | 1,766 |
| Golden Valley | 719 | 77.56% | 195 | 21.04% | 6 | 0.65% | 3 | 0.32% | 4 | 0.43% | 524 | 56.52% | 927 |
| Grand Forks | 17,298 | 56.77% | 12,646 | 41.50% | 348 | 1.14% | 137 | 0.45% | 41 | 0.13% | 4,652 | 15.27% | 30,470 |
| Grant | 952 | 76.65% | 264 | 21.26% | 16 | 1.29% | 4 | 0.32% | 6 | 0.48% | 688 | 55.39% | 1,242 |
| Griggs | 907 | 63.03% | 505 | 35.09% | 14 | 0.97% | 9 | 0.63% | 4 | 0.28% | 402 | 27.94% | 1,439 |
| Hettinger | 1,044 | 69.88% | 405 | 27.11% | 35 | 2.34% | 6 | 0.40% | 4 | 0.27% | 639 | 42.77% | 1,494 |
| Kidder | 902 | 65.89% | 433 | 31.63% | 20 | 1.46% | 7 | 0.51% | 7 | 0.51% | 469 | 34.26% | 1,369 |
| LaMoure | 1,592 | 68.18% | 712 | 30.49% | 17 | 0.73% | 5 | 0.21% | 9 | 0.39% | 880 | 37.69% | 2,335 |
| Logan | 844 | 74.69% | 265 | 23.45% | 15 | 1.33% | 2 | 0.18% | 4 | 0.35% | 579 | 51.24% | 1,130 |
| McHenry | 1,744 | 61.84% | 1,030 | 36.52% | 36 | 1.28% | 7 | 0.25% | 3 | 0.11% | 714 | 25.32% | 2,820 |
| McIntosh | 1,254 | 72.82% | 436 | 25.32% | 24 | 1.39% | 3 | 0.17% | 5 | 0.29% | 818 | 47.50% | 1,722 |
| McKenzie | 1,897 | 68.68% | 847 | 30.67% | 15 | 0.54% | 2 | 0.07% | 1 | 0.04% | 1,050 | 38.01% | 2,762 |
| McLean | 3,014 | 63.45% | 1,664 | 35.03% | 57 | 1.20% | 8 | 0.17% | 7 | 0.15% | 1,350 | 28.42% | 4,750 |
| Mercer | 3,285 | 71.17% | 1,245 | 26.97% | 68 | 1.47% | 8 | 0.17% | 10 | 0.22% | 2,040 | 44.20% | 4,616 |
| Morton | 8,325 | 65.90% | 4,073 | 32.24% | 191 | 1.51% | 31 | 0.25% | 13 | 0.10% | 4,252 | 33.66% | 12,633 |
| Mountrail | 1,527 | 50.40% | 1,465 | 48.35% | 30 | 0.99% | 6 | 0.20% | 2 | 0.07% | 62 | 2.05% | 3,030 |
| Nelson | 1,107 | 57.60% | 778 | 40.48% | 26 | 1.35% | 6 | 0.31% | 5 | 0.26% | 329 | 17.12% | 1,922 |
| Oliver | 790 | 70.60% | 310 | 27.70% | 15 | 1.34% | 1 | 0.09% | 3 | 0.27% | 480 | 42.90% | 1,119 |
| Pembina | 2,466 | 63.95% | 1,321 | 34.26% | 53 | 1.37% | 8 | 0.21% | 8 | 0.21% | 1,145 | 29.69% | 3,856 |
| Pierce | 1,475 | 67.20% | 686 | 31.25% | 24 | 1.09% | 2 | 0.09% | 8 | 0.36% | 789 | 35.95% | 2,195 |
| Ramsey | 2,943 | 60.06% | 1,885 | 38.47% | 58 | 1.18% | 9 | 0.18% | 5 | 0.10% | 1,058 | 21.59% | 4,900 |
| Ransom | 1,352 | 51.96% | 1,199 | 46.08% | 40 | 1.54% | 9 | 0.35% | 2 | 0.08% | 153 | 5.88% | 2,602 |
| Renville | 953 | 64.87% | 497 | 33.83% | 18 | 1.23% | 1 | 0.07% | 0 | 0.00% | 456 | 31.04% | 1,469 |
| Richland | 5,264 | 64.08% | 2,821 | 34.34% | 94 | 1.14% | 25 | 0.30% | 11 | 0.13% | 2,443 | 29.74% | 8,215 |
| Rolette | 1,392 | 34.42% | 2,564 | 63.40% | 66 | 1.63% | 15 | 0.37% | 7 | 0.17% | -1,172 | -28.98% | 4,044 |
| Sargent | 1,147 | 52.14% | 1,021 | 46.41% | 28 | 1.27% | 4 | 0.18% | 0 | 0.00% | 126 | 5.73% | 2,200 |
| Sheridan | 727 | 77.01% | 200 | 21.19% | 12 | 1.27% | 4 | 0.42% | 1 | 0.11% | 527 | 55.82% | 944 |
| Sioux | 319 | 27.98% | 804 | 70.53% | 12 | 1.05% | 2 | 0.18% | 3 | 0.26% | -485 | -42.55% | 1,140 |
| Slope | 335 | 77.55% | 89 | 20.60% | 5 | 1.16% | 2 | 0.46% | 1 | 0.23% | 246 | 56.95% | 432 |
| Stark | 7,220 | 69.42% | 3,013 | 28.97% | 126 | 1.21% | 19 | 0.18% | 22 | 0.21% | 4,207 | 40.45% | 10,400 |
| Steele | 586 | 48.31% | 616 | 50.78% | 7 | 0.58% | 2 | 0.16% | 2 | 0.16% | -30 | -2.47% | 1,213 |
| Stutsman | 6,517 | 64.38% | 3,438 | 33.97% | 135 | 1.33% | 19 | 0.19% | 13 | 0.13% | 3,079 | 30.41% | 10,122 |
| Towner | 754 | 54.21% | 606 | 43.57% | 25 | 1.80% | 2 | 0.14% | 4 | 0.29% | 148 | 10.64% | 1,391 |
| Traill | 2,543 | 59.86% | 1,651 | 38.87% | 43 | 1.01% | 6 | 0.14% | 5 | 0.12% | 892 | 20.99% | 4,248 |
| Walsh | 3,194 | 61.59% | 1,905 | 36.73% | 61 | 1.18% | 17 | 0.33% | 9 | 0.17% | 1,289 | 24.86% | 5,186 |
| Ward | 17,008 | 66.41% | 8,236 | 32.16% | 276 | 1.08% | 60 | 0.23% | 32 | 0.12% | 8,772 | 34.25% | 25,612 |
| Wells | 1,654 | 64.58% | 858 | 33.50% | 35 | 1.37% | 3 | 0.12% | 9 | 0.35% | 796 | 31.08% | 2,561[c] |
| Williams | 6,278 | 70.31% | 2,512 | 28.13% | 109 | 1.22% | 18 | 0.20% | 12 | 0.13% | 3,766 | 42.18% | 8,929 |
| Totals | 196,651 | 62.86% | 111,052 | 35.50% | 3,756 | 1.20% | 851 | 0.27% | 514 | 0.16% | 85,599 | 27.36% | 312,833 |
Counties that flipped from Republican to Democratic
edit- Benson (Largest CDP: Fort Totten)
- Steele (Largest city: Finley)
By congressional district
editDue to the state's low population, only one congressional district is allocated. This district is called the At-Large district, because it covers the entire state, and thus is equivalent to the statewide election results.
| District | Bush | Kerry | Representative |
|---|---|---|---|
| At-large | 62.86% | 35.5% | Earl Pomeroy |
Electors
editTechnically the voters of ND cast their ballots for electors: representatives to the Electoral College. ND is allocated 3 electors because it has 1 congressional district and 2 senators. All candidates who appear on the ballot or qualify to receive write-in votes must submit a list of 3 electors, who pledge to vote for their candidate and his or her running mate. Whoever wins the majority of votes in the state is awarded all 3 electoral votes. Their chosen electors then vote for president and vice president. Although electors are pledged to their candidate and running mate, they are not obligated to vote for them. An elector who votes for someone other than his or her candidate is known as a faithless elector.
The electors of each state and the District of Columbia met on December 13, 2004, to cast their votes for president and vice president. The Electoral College itself never meets as one body. Instead the electors from each state and the District of Columbia met in their respective capitols.
The following were the members of the Electoral College from the state. All were pledged to and voted for Bush and Cheney:[10]
- Betsy Dalrymple (wife of Jack Dalrymple)
- Ben Clayburgh
- Jackie Williams
See also
editNotes
editReferences
edit- ^ "DC's Political Report 2004". dcpoliticalreport.com. Archived from the original on November 21, 2010. Retrieved January 15, 2022.
- ^ Leiper, Dave. "2004 Presidential Election Polls – North Dakota". US Election Atlas.
- ^ "George W Bush - $374,659,453 raised, '04 election cycle, Republican Party, President". Campaignmoney.com. Retrieved March 1, 2020.
- ^ "John F Kerry - $345,826,176 raised, '04 election cycle, Democrat Party, President". Campaignmoney.com. Retrieved March 1, 2020.
- ^ "CNN.com Specials". CNN.
- ^ "CNN.com Specials". CNN.
- ^ a b "2004 Presidential General Election Results – North Dakota". David Leip. Retrieved March 25, 2014.
- ^ "Official General Election Results for United States President" (PDF). Archived from the original (PDF) on May 13, 2009. Retrieved July 17, 2009.
- ^ "ND US President Race, November 02, 2004". Our Campaigns.
- ^ "Grand Forks news, sports, jobs, homes, cars". Archived from the original on January 4, 2006. Retrieved October 10, 2009.

