List of parliamentary constituencies in Norfolk
The county of Norfolk is divided into 9 parliamentary constituencies - 2 borough constituencies and 7 county constituencies.
Constituencies
editConservative † Labour ‡ Liberal Democrat ¤ Reform UK ± Green ¥
| Constituency[nb 1] | Electorate[1] | Majority[2][nb 2] | Member of Parliament[2] | Nearest opposition[2] | Map | ||
|---|---|---|---|---|---|---|---|
| Broadland and Fakenham CC | 72,907 | 719 | Jerome Mayhew † | Iain Simpson ‡ |  | ||
| Great Yarmouth CC | 70,077 | 1,426 | Rupert Lowe ± | Keir Cozens ‡ |  | ||
| Mid Norfolk CC | 71,060 | 3,054 | George Freeman † | Michael Rosen ‡ |  | ||
| North Norfolk CC | 70,719 | 2,585 | Steffan Aquarone ¤ | Duncan Baker † |  | ||
| North West Norfolk CC | 75,200 | 4,954 | James Wild † | Tim Leaver ‡ |  | ||
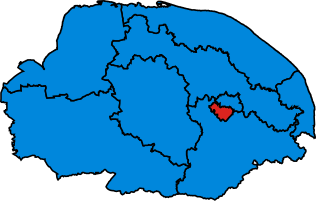
| Norwich North BC | 71,441 | 10,850 | Alice Macdonald ‡ | Charlotte Salomon † |  | ||
| Norwich South BC | 73,301 | 13,239 | Clive Lewis ‡ | Jamie Osborn ¥ |  | ||
| South Norfolk CC | 69,837 | 2,826 | Ben Goldsborough ‡ | Poppy Simister-Thomas † |  | ||
| South West Norfolk CC | 72,496 | 630 | Terry Jermy ‡ | Liz Truss † |  | ||
| Waveney Valley CC[nb 3] | 70,540 | 5,593 | Adrian Ramsay ¥ | Richard Rout † |  | ||
2024 boundary changes
editSee 2023 Periodic Review of Westminster constituencies for further details.
Following the abandonment of the Sixth Periodic Review (the 2018 review), the Boundary Commission for England formally launched the 2023 Review on 5 January 2021.[3] Initial proposals were published on 8 June 2021 and, following two periods of public consultation, revised proposals were published on 8 November 2022. The final proposals were published on 28 June 2023.
The commission has proposed that Norfolk be combined with Suffolk as a sub-region of the Eastern Region, with the creation of the cross-county boundary constituency of Waveney Valley. Broadland would be renamed Broadland and Fakenham.[4][5]
The following constituencies were proposed:
Containing electoral wards from Breckland
- Mid Norfolk (part)
- South West Norfolk (part)
Containing electoral wards from Broadland
- Broadland and Fakenham (part)
- Norwich North (part)
Containing electoral wards in Great Yarmouth
Containing electoral wards in King's Lynn and West Norfolk
- North West Norfolk
- South West Norfolk (part)
Containing electoral wards in North Norfolk
- Broadland and Fakenham (part)
- North Norfolk
Containing electoral wards in Norwich
- Norwich North (part)
- Norwich South (part)
Containing electoral wards in South Norfolk
- Mid Norfolk (part)
- Norwich South (part)
- South Norfolk
- Waveney Valley (parts also in East Suffolk and Mid Suffolk)
Results history
editPrimary data source: House of Commons research briefing - General election results from 1918 to 2019[6]
2024
editThe number of votes cast for each political party who fielded candidates in constituencies comprising Norfolk in the 2024 general election were as follows:[nb 4][2]
| Party | Votes | % | Change from 2019 | Seats | Change from 2019 |
|---|---|---|---|---|---|
| Conservative | 132,494 | 28.70% | 3 | ||
| Labour | 132,398 | 28.68% | 4 | ||
| Reform | 86,482 | 18.7% | 1 | ||
| Liberal Democrats | 50,962 | 11.0% | 1 | ||
| Greens | 50,249 | 10.9% | 1 | ||
| Others | 8,999 | 1.9% | 0 | 0 | |
| Total | 461,584 | 100.0 | 10 |
Percentage votes
edit| Election year | 1950 | 1951 | 1955 | 1959 | 1964 | 1966 | 1970 | 1974
(Feb) |
1974
(Oct) |
1979 | 1983 | 1987 | 1992 | 1997 | 2001 | 2005 | 2010 | 2015 | 2017 | 2019 | 2024 |
|---|---|---|---|---|---|---|---|---|---|---|---|---|---|---|---|---|---|---|---|---|---|
| Conservative1 | 44.2 | 50.4 | 50.5 | 50.6 | 47.8 | 47.7 | 51.4 | 42.7 | 43.3 | 50.9 | 49.7 | 51.0 | 49.2 | 36.7 | 41.6 | 39.9 | 43.1 | 44.9 | 52.7 | 57.6 | 28.7 |
| Labour | 46.9 | 49.6 | 49.5 | 47.3 | 46.8 | 51.0 | 43.6 | 35.3 | 38.9 | 35.7 | 22.0 | 22.9 | 31.2 | 39.9 | 35.5 | 30.0 | 19.0 | 22.7 | 33.4 | 25.9 | 28.7 |
| Reform2 | - | - | - | - | - | - | - | - | - | - | - | - | - | - | - | - | - | - | - | 0.7 | 18.7 |
| Liberal Democrat3 | 8.8 | - | - | 2.1 | 5.3 | 1.3 | 4.8 | 21.7 | 17.7 | 12.8 | 27.9 | 25.8 | 18.6 | 18.2 | 19.6 | 25.4 | 27.8 | 10.3 | 10.0 | 12.4 | 11.0 |
| Green Party | - | - | - | - | - | - | - | - | - | - | - | * | * | * | * | * | 3.2 | 5.1 | 1.6 | 2.5 | 10.9 |
| UKIP | - | - | - | - | - | - | - | - | - | - | - | - | - | * | * | * | 4.6 | 17.0 | 2.3 | * | * |
| Other | - | - | - | - | 0.1 | - | 0.2 | 0.3 | 0.1 | 0.6 | 0.3 | 0.2 | 1.0 | 5.1 | 3.3 | 4.7 | 2.3 | 0.1 | 0.1 | 0.8 | 1.9 |
1Includes National Liberal Party up to 1966
2As the Brexit Party in 2019
31950-1979 - Liberal; 1983 & 1987 - SDP-Liberal Alliance
* Included in Other
Seats
edit| Election year | 1950 | 1951 | 1955 | 1959 | 1964 | 1966 | 1970 | 1974
(Feb) |
1974
(Oct) |
1979 | 1983 | 1987 | 1992 | 1997 | 2001 | 2005 | 2010 | 2015 | 2017 | 2019 | 2024 |
|---|---|---|---|---|---|---|---|---|---|---|---|---|---|---|---|---|---|---|---|---|---|
| Labour | 5 | 2 | 3 | 3 | 4 | 5 | 1 | 2 | 2 | 2 | 0 | 1 | 1 | 4 | 3 | 3 | 0 | 1 | 1 | 1 | 4 |
| Conservative1 | 3 | 6 | 5 | 5 | 4 | 3 | 7 | 5 | 5 | 5 | 8 | 7 | 7 | 4 | 4 | 4 | 7 | 7 | 7 | 8 | 3 |
| Reform | - | - | - | - | - | - | - | - | - | - | - | - | - | - | - | - | - | - | - | - | 1 |
| Liberal Democrat2 | 0 | 0 | 0 | 0 | 0 | 0 | 0 | 0 | 0 | 0 | 0 | 0 | 0 | 0 | 1 | 1 | 2 | 1 | 1 | 0 | 1 |
| Greens | - | - | - | - | - | - | - | - | - | - | - | 0 | 0 | 0 | 0 | 0 | 0 | 0 | 0 | 0 | 1 |
| Total | 8 | 8 | 8 | 8 | 8 | 8 | 8 | 7 | 7 | 7 | 8 | 8 | 8 | 8 | 8 | 8 | 9 | 9 | 9 | 9 | 10 |
1Includes National Liberal Party up to 1966
21950-1979 - Liberal; 1983 & 1987 - SDP-Liberal Alliance
Maps
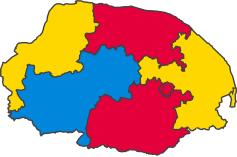
edit1885-1910
edit-
 1885
1885 -
 1886
1886 -
 1892
1892 -
 1895
1895 -
 1900
1900 -
 1906
1906 -
 Jan 1910
 -
 Dec 1910


1918-1945
edit-
 1918
1918 -
 1922
1922 -
 1923
1923 -
 1924
1924 -
 1929
1929 -
 1931
1931 -
1935
-
 1945
1945


1950-1979
edit-
 1950
1950 -
 1951
1951 -
 1955
1955 -
1959
-
 1964
1964 -
 1966
1966 -
 1970
1970 -
 1974 Feb
 -
1974 Oct
-
1979


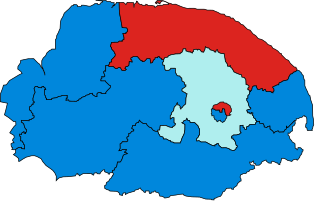
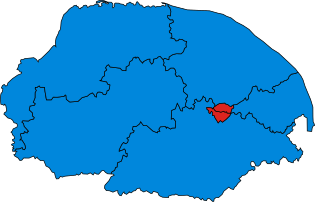
1983-2019
edit-
 1983
1983 -
 1987
1987 -
1992
-
 1997
1997 -
 2001
2001 -
2005
-
 2010
2010 -
 2015
2015 -
2017
-
 2019
2019


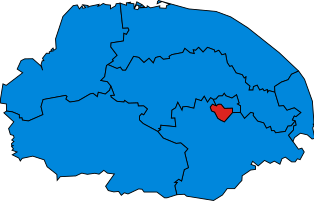
2024-present
edit-
 2024
2024

Timeline
editGreen represents former constituencies, pink represents current ones.
| Constituency | 1295-1298 | 1298-1529 | 1529-1558 | 1558-1832 | 1832-1867 | 1867-1885 | 1885-1918 | 1918-1950 | 1950-1974 | 1974-1983 | 1983-2010 | 2010–present |
|---|---|---|---|---|---|---|---|---|---|---|---|---|
| Broadland | 2010–present | |||||||||||
| Castle Rising | 1558-1832 | |||||||||||
| Central Norfolk | 1950-1974 | |||||||||||
| East Norfolk | 1832-1867 | 1885-1950 | ||||||||||
| Great Yarmouth | 1295-1867 | 1885–present | ||||||||||
| King's Lynn | 1298-1974 | |||||||||||
| Mid Norfolk | 1885-1918 | 1983–present | ||||||||||
| Norfolk | 1295-1832 | |||||||||||
| North Norfolk | 1867–present | |||||||||||
| North West Norfolk | 1885-1918 | 1974–present | ||||||||||
| Norwich | 1298-1950 | |||||||||||
| Norwich North | 1950–present | |||||||||||
| Norwich South | 1950–present | |||||||||||
| South Norfolk | 1867–present | |||||||||||
| South West Norfolk | 1885–present | |||||||||||
| Thetford | 1529-1867 | |||||||||||
| West Norfolk | 1832-1885 | |||||||||||
Historical representation by party
editA cell marked → (with a different colour background to the preceding cell) indicates that the previous MP continued to sit under a new party name.
1885 to 1918
editConservative Labour Liberal Liberal Unionist
| Constituency | 1885 | 86 | 1886 | 86 | 1892 | 93 | 95 | 1895 | 98 | 99 | 1900 | 04 | 1906 | 06 | Jan 1910 | Dec 1910 | 12 | 15 | 18 |
|---|---|---|---|---|---|---|---|---|---|---|---|---|---|---|---|---|---|---|---|
| Great Yarmouth | Tyler | Moorsom | Colomb | Fell | |||||||||||||||
| King's Lynn | Bourke | Jarvis | Bowles | Bellairs | → | Bowles | Ingleby | ||||||||||||
| Norfolk East | Birkbeck | Price | |||||||||||||||||
| Norfolk Mid | R. Gurdon | → | Higgins | → | R. Gurdon | Wilson | Wodehouse | Boyle | → | Jodrell | |||||||||
| Norfolk North | Cozens-Hardy | W. Gurdon | Buxton | ||||||||||||||||
| Norfolk North West | Arch | Cavendish-Bentinck | Arch | White | Hemmerde | ||||||||||||||
| Norfolk South | Taylor | → | Soames | ||||||||||||||||
| Norfolk South West | Tyssen-Amherst | Hare | Winfrey | ||||||||||||||||
| Norwich (Two members) | Colman | Bullard | Tillett | Low | Young | ||||||||||||||
| Bullard | Hoare | Roberts | |||||||||||||||||
1918 to 1950
editCoalition Labour Coalition Liberal (1918-22) / National Liberal (1922-23) Conservative Independent Labour Liberal
| Constituency | 1918 | 20 | 1922 | 1923 | 1924 | 26 | 1929 | 30 | 31 | 1931 | 1935 | 39 | 41 | 43 | 1945 |
|---|---|---|---|---|---|---|---|---|---|---|---|---|---|---|---|
| Great Yarmouth | Fell | Harbord | Meyer | Harbord | → | Jewson | Kinghorn | ||||||||
| King's Lynn | Jodrell | Woodwark | Roche | Maxwell | Roche | Wise | |||||||||
| Norfolk East | Falcon | Seely | Neville | Lygon | → | Medlicott | |||||||||
| Norfolk North | King | → | Buxton | Noel-Buxton | Cook | Gooch | |||||||||
| Norfolk South | Cozens-Hardy | Edwards | Hay | Edwards | Christie | Mayhew | |||||||||
| Norfolk South West | Winfrey | → | McLean | Taylor | McLean | de Chair | Dye | ||||||||
| Norwich (Two members) | Young | → | Jewson | Young | → | Shakespeare | → | Paton | |||||||
| Roberts | → | Smith | Fairfax | Smith | Hartland | Strauss | Noel-Buxton | ||||||||
1950 to 1983
editConservative Labour National Liberal (1931-68) Social Democratic
| Constituency | 1950 | 1951 | 55 | 1955 | 59 | 1959 | 62 | 1964 | 1966 | 1970 | Feb 1974 | Oct 1974 | 1979 | 81 |
|---|---|---|---|---|---|---|---|---|---|---|---|---|---|---|
| Great Yarmouth | Kinghorn | Fell | Gray | Fell | ||||||||||
| King's Lynn / North West Norfolk (1974) | Wise | Scott-Miller | Bullard | Page | Brocklebank-Fowler | → | ||||||||
| Norfolk Central | Medlicott | Collard | Gilmour | → | ||||||||||
| Norfolk North | Gooch | Hazell | Howell | |||||||||||
| Norfolk South | Baker | Hill | MacGregor | |||||||||||
| Norfolk South West | Dye | Bullard | Dye | Hilton | Hawkins | |||||||||
| Norwich North | Paton | Wallace | Ennals | |||||||||||
| Norwich South | Strauss | Rippon | Norwood | Stuttaford | Garrett | |||||||||
1983 to present
editConservative Labour Liberal Democrats Reform
| Constituency | 1983 | 1987 | 1992 | 1997 | 2001 | 2005 | 09 | 2010 | 2015 | 2017 | 2019 | 2024 |
|---|---|---|---|---|---|---|---|---|---|---|---|---|
| Broadland / Broadland & Fakenham ('24) | Simpson | Mayhew | ||||||||||
| Mid Norfolk | Ryder | Simpson | Freeman | |||||||||
| South Norfolk | MacGregor | Bacon | Goldsborough | |||||||||
| South West Norfolk | Hawkins | Shephard | Fraser | Truss | Jermy | |||||||
| North Norfolk | Howell | Prior | Lamb | Baker | Aquarone | |||||||
| North West Norfolk | Bellingham | Turner | Bellingham | Wild | ||||||||
| Great Yarmouth | Carttiss | Wright | B. Lewis | Lowe | ||||||||
| Norwich North | Thompson | Gibson | Smith | Macdonald | ||||||||
| Norwich South | Powley | Garrett | Clarke | Wright | C. Lewis | |||||||
See also
editNotes
edit- ^ BC denotes borough constituency, CC denotes county constituency.
- ^ The majority is the number of votes the winning candidate receives more than their nearest rival.
- ^ Cross-County constituency with Suffolk
- ^ It should be acknowledged that as Waveney Valley is a cross-county constituency between Norfolk and Suffolk, and the results of UK elections on sub-constituency levels are not disclosed, the following vote shares include parts of the Waveney Valley constituency located in Suffolk.
References
edit- ^ Baker, Carl; Uberoi, Elise; Cracknell, Richard (28 January 2020). "General Election 2019: full results and analysis".
{{cite journal}}: Cite journal requires|journal=(help) - ^ a b c d "Constituencies A-Z - Election 2014". BBC News. Retrieved 8 July 2024.
- ^ "2023 Review | Boundary Commission for England". boundarycommissionforengland.independent.gov.uk. Retrieved 9 October 2021.
- ^ "Parliamentary constituency changes affect Norfolk/Suffolk border". BBC News. 8 November 2022. Retrieved 12 December 2022.
- ^ "The 2023 Review of Parliamentary Constituency Boundaries in England – Volume one: Report | Boundary Commission for England". paras 263-293. Retrieved 9 July 2023.
- ^ Watson, Christopher; Uberoi, Elise; Loft, Philip (17 April 2020). "General election results from 1918 to 2019".
{{cite journal}}: Cite journal requires|journal=(help)