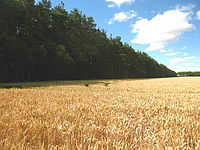
This list of renewable resources produced and traded by the United Kingdom presents various renewable resources such as crops for food or fuel, livestock and wood with accompanying information being given on its production and trade by the United Kingdom.

(For non-renewable resources of the United Kingdom see: Coal mining in the United Kingdom, Hydraulic fracturing in the United Kingdom, Mining in the United Kingdom and North Sea oil).
Agriculture in the United Kingdom
edit| Crops and livestock (2013)[1] (quantities in thousands of tonnes unless otherwise specified) |
Area used (thousands of hectares) |
production (in UK) |
Imports from the EU |
Imports from the rest of the world |
Exports to the EU |
Exports to the rest of the world |
|---|---|---|---|---|---|---|
| Total cereals | 3 029 | 20 083 | 3 942 | 1 143 | 1 030 | 420 |
| Oilseed rape | 715 | 2 128 | 148 | 29 | 429 | 2 |
| Linseed | 35 | 62 | 11 | 2 | 37 | - |
| Sugar beet | 117 | 1320 | 422 | 691 | 135 | 98 |
| Peas for harvesting dry | 13 | 48 | -- | -- | -- | -- |
| Field beans | 118 | 378 | -- | -- | -- | -- |
| Fresh vegetables | 131 | 2,608 | 1,971 | 265 | 76 | 5 |
| Plants and flowers | 20 | -- | -- | -- | -- | -- |
| Potatoes | 139 | 5 685 | -- | -- | -- | -- |
| Fresh fruit | 29 | 388 | 1,368 | 2,193 | 145 | 2 |
| Cattle and calves; beef and veal | -- | 842 | 224 | 82 | 122 | 5 |
| Pigs and pig meat | -- | 791 | 712 | 10 | 153 | 54 |
| Sheep and lambs; mutton and lamb | -- | 300 | 18 | 102 | 118 | 1 |
| Poultry and poultry meat | -- | 1,662 | 449 | 30 | 213 | 91 |
| Milk (in millions of litres) | -- | 13 546 | 132 | 473 | ||
| Hen eggs (in millions of dozens) | -- | 829 | 152 | 1 | 23 | - |
Forestry in the United Kingdom
edit| Wood and pulp (2004)[2] | UK Production | Imports | Exports | Apparent consumption | Units |
|---|---|---|---|---|---|
| Sawnwood | 2 782 | 8 647 | 370 | 11 059 | 1,000m3 |
| Woodbased panels | 3 533 | 3 786 | 511 | 6 808 | 1,000m3 |
| Paper & paperboard | 6 240 | 7 442 | 1 547 | 12 135 | 1,000mt |
Aquaculture and fishing in the United Kingdom
editThis section needs expansion. You can help by adding to it. (October 2018) |
Updated statistics from the UK's Marine Management Organisation on the UK fishing sector show that UK vessels landed 724 thousand tonnes of sea fish in 2017, with a value of £980 million. 290 thousand tonnes of this haul was landed abroad by UK vessels.[3]
Renewable energy in the United Kingdom
editIn 2013 the United Kingdom had a total of electricity generated from, renewable sources of 53,667 GWh.[4]
The demand for electricity (produced from renewable and non-renewable sources) in the United Kingdom through 2013 measured:
104,124GWh (first quarter), 86,830GWh (second quarter), 83,811GWh (third quarter), 96,457GWh (fourth quarter),[5]
producing a total of 371,222GWh (2013).
See also
edit- Agriculture in the United Kingdom
- Beekeeping in the United Kingdom
- British timber trade
- Demographics of the United Kingdom
- Department for Environment, Food and Rural Affairs
- Environmental impact of agriculture
- Environmental impact of fishing
- Environmental impact of shipping
- Entomophagy, Consumption of insects
- Fishing industry in Scotland
- Food waste in the United Kingdom
- Forestry in the United Kingdom
- Hunting and shooting in the United Kingdom
- Renewable Transport Fuel Obligation
- Victory garden
References
edit- ^ "Agriculture in the United Kingdom" (PDF). Gov.uk. Defra. Retrieved 25 July 2014.
- ^ "Imports, exports & apparent consumption of wood products". Forestry.gov.uk. Forestry Commission. Retrieved 25 July 2014.
- ^ Marine Management Organisation (27 September 2018). "Fishing industry in 2017 statistics published". gov.uk. Retrieved 16 October 2018.
- ^ "Renewable energy in 2013" (PDF). Gov.uk.
- ^ "ENERGY TRENDS JUNE 2014: Section 5 – Electricity" (PDF). Gov.uk. p. 41.