Panshi (Chinese: 磐石; pinyin: Pánshí) is a city of south-central Jilin province of Northeast China. It is under the administration of Jilin City.
Panshi
磐石市 P'an-shih | |
|---|---|
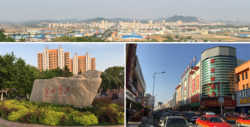
 Panoramic view of Panshi city, entrance to Peoples' Square, downtown shopping strip. | |
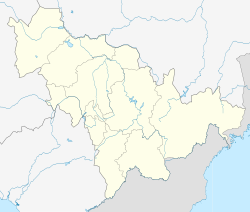
| Coordinates: 42°57′N 126°04′E / 42.950°N 126.067°E | |
| Country | People's Republic of China |
| Province | Jilin |
| Prefecture-level city | Jilin City |
| City Seat | Henan Subdistrict (河南街道) |
| Area | |
| • County-level city | 3,960.0 km2 (1,529.0 sq mi) |
| • Urban | 25.00 km2 (9.65 sq mi) |
| Elevation | 331 m (1,086 ft) |
| Population (2017)[1] | |
| • County-level city | 528,000 |
| • Urban | 122,200 |
| Time zone | UTC+8 (China Standard) |
Subdistricts:
- Henan Subdistrict (河南街道), Dongning Subdistrict (东宁街道), Fu'an Subdistrict (福安街道)
Towns:
- Yantongshan (烟筒山镇), Mingcheng (明城镇), Jichang (吉昌镇), Quchaihe (取柴河镇), Yima (驿马镇), Shiju (石咀镇), Futai (富太镇), hulan (呼兰镇), Hongqiling (红旗岭镇), Songshan (松山镇), Heishi (黑石镇), Niuxin (牛心镇), Chaoyangshan (朝阳山镇)
Townships:
- Baoshan Township (宝山乡)
Climate
edit| Climate data for Panshi, elevation 351 m (1,152 ft), (1991–2020 normals, extremes 1981–2010) | |||||||||||||
|---|---|---|---|---|---|---|---|---|---|---|---|---|---|
| Month | Jan | Feb | Mar | Apr | May | Jun | Jul | Aug | Sep | Oct | Nov | Dec | Year |
| Record high °C (°F) | 5.3 (41.5) |
12.9 (55.2) |
18.5 (65.3) |
29.7 (85.5) |
34.0 (93.2) |
35.8 (96.4) |
35.4 (95.7) |
34.1 (93.4) |
30.3 (86.5) |
26.3 (79.3) |
19.4 (66.9) |
9.8 (49.6) |
35.8 (96.4) |
| Mean daily maximum °C (°F) | −8.6 (16.5) |
−3.4 (25.9) |
4.3 (39.7) |
14.3 (57.7) |
21.4 (70.5) |
25.7 (78.3) |
27.7 (81.9) |
26.5 (79.7) |
22.0 (71.6) |
13.9 (57.0) |
2.5 (36.5) |
−6.3 (20.7) |
11.7 (53.0) |
| Daily mean °C (°F) | −16.8 (1.8) |
−11.3 (11.7) |
−1.9 (28.6) |
7.7 (45.9) |
14.9 (58.8) |
20.0 (68.0) |
22.8 (73.0) |
21.3 (70.3) |
14.9 (58.8) |
6.7 (44.1) |
−3.5 (25.7) |
−13.4 (7.9) |
5.1 (41.2) |
| Mean daily minimum °C (°F) | −23.8 (−10.8) |
−18.8 (−1.8) |
−7.9 (17.8) |
1.1 (34.0) |
8.3 (46.9) |
14.6 (58.3) |
18.3 (64.9) |
16.7 (62.1) |
8.8 (47.8) |
0.5 (32.9) |
−8.8 (16.2) |
−19.6 (−3.3) |
−0.9 (30.4) |
| Record low °C (°F) | −41.8 (−43.2) |
−38.5 (−37.3) |
−27.8 (−18.0) |
−11.9 (10.6) |
−4.1 (24.6) |
4.4 (39.9) |
9.2 (48.6) |
3.2 (37.8) |
−4.3 (24.3) |
−13.0 (8.6) |
−27.8 (−18.0) |
−39.4 (−38.9) |
−41.8 (−43.2) |
| Average precipitation mm (inches) | 6.3 (0.25) |
9.7 (0.38) |
16.2 (0.64) |
32.9 (1.30) |
65.8 (2.59) |
112.9 (4.44) |
187.2 (7.37) |
168.1 (6.62) |
57.1 (2.25) |
38.3 (1.51) |
22.3 (0.88) |
11.4 (0.45) |
728.2 (28.68) |
| Average precipitation days (≥ 0.1 mm) | 6.2 | 5.2 | 6.8 | 8.2 | 12.3 | 14.4 | 14.7 | 14.2 | 9.5 | 8.4 | 7.9 | 7.3 | 115.1 |
| Average snowy days | 9.6 | 7.4 | 8.8 | 3.3 | 0.1 | 0 | 0 | 0 | 0 | 1.9 | 7.7 | 9.8 | 48.6 |
| Average relative humidity (%) | 70 | 66 | 61 | 54 | 59 | 70 | 80 | 82 | 76 | 69 | 71 | 72 | 69 |
| Mean monthly sunshine hours | 163.5 | 182.7 | 209.2 | 206.6 | 226.9 | 215.9 | 196.4 | 198.9 | 216.5 | 193.4 | 152.9 | 147.0 | 2,309.9 |
| Percent possible sunshine | 56 | 61 | 56 | 51 | 50 | 47 | 43 | 47 | 58 | 57 | 53 | 53 | 53 |
| Source: China Meteorological Administration[3][4] | |||||||||||||
| Climate data for Yantongshan, Panshi (1991−2020 normals) | |||||||||||||
|---|---|---|---|---|---|---|---|---|---|---|---|---|---|
| Month | Jan | Feb | Mar | Apr | May | Jun | Jul | Aug | Sep | Oct | Nov | Dec | Year |
| Mean daily maximum °C (°F) | −8.5 (16.7) |
−3.4 (25.9) |
4.4 (39.9) |
14.7 (58.5) |
21.7 (71.1) |
26.1 (79.0) |
27.9 (82.2) |
26.7 (80.1) |
22.3 (72.1) |
14.1 (57.4) |
2.7 (36.9) |
−6.2 (20.8) |
11.9 (53.4) |
| Daily mean °C (°F) | −16.1 (3.0) |
−10.8 (12.6) |
−1.6 (29.1) |
8.1 (46.6) |
15.3 (59.5) |
20.4 (68.7) |
23.0 (73.4) |
21.4 (70.5) |
15.2 (59.4) |
7.1 (44.8) |
−3.0 (26.6) |
−12.6 (9.3) |
5.5 (42.0) |
| Mean daily minimum °C (°F) | −22.6 (−8.7) |
−17.7 (0.1) |
−7.4 (18.7) |
1.6 (34.9) |
9.0 (48.2) |
15.0 (59.0) |
18.5 (65.3) |
16.9 (62.4) |
9.1 (48.4) |
1.1 (34.0) |
−8.3 (17.1) |
−18.4 (−1.1) |
−0.3 (31.5) |
| Average precipitation mm (inches) | 5.3 (0.21) |
7.3 (0.29) |
14.7 (0.58) |
30.2 (1.19) |
67.6 (2.66) |
121.3 (4.78) |
176.7 (6.96) |
169.2 (6.66) |
57.9 (2.28) |
36.6 (1.44) |
20.8 (0.82) |
8.9 (0.35) |
716.5 (28.22) |
| Average precipitation days (≥ 0.1 mm) | 6.7 | 6.1 | 6.9 | 7.9 | 12.5 | 14.2 | 14.6 | 14.1 | 9.3 | 8.4 | 7.4 | 7.5 | 115.6 |
| Average snowy days | 9.3 | 7.4 | 8.3 | 2.7 | 0.1 | 0 | 0 | 0 | 0 | 2.2 | 7.3 | 9.6 | 46.9 |
| Average relative humidity (%) | 70 | 65 | 59 | 52 | 58 | 69 | 80 | 83 | 76 | 66 | 68 | 70 | 68 |
| Mean monthly sunshine hours | 164.9 | 183.7 | 211.4 | 209.4 | 231.0 | 216.3 | 198.1 | 197.8 | 213.2 | 187.8 | 152.6 | 145.1 | 2,311.3 |
| Percent possible sunshine | 57 | 62 | 57 | 52 | 51 | 47 | 43 | 46 | 58 | 56 | 53 | 52 | 53 |
| Source: China Meteorological Administration[5][6] | |||||||||||||
References
edit- ^ a b Ministry of Housing and Urban-Rural Development, ed. (2019). China Urban Construction Statistical Yearbook 2017. Beijing: China Statistics Press. p. 50. Retrieved 11 January 2020.
- ^ 吉林市-行政区划网 xzqh.org
- ^ 中国气象数据网 – WeatherBk Data (in Simplified Chinese). China Meteorological Administration. Retrieved 7 July 2023.
- ^ 中国气象数据网 (in Simplified Chinese). China Meteorological Administration. Retrieved 7 July 2023.
- ^ 中国气象数据网 – WeatherBk Data (in Simplified Chinese). China Meteorological Administration. Retrieved 5 October 2023.
- ^ 中国气象数据网 (in Simplified Chinese). China Meteorological Administration. Retrieved 5 October 2023.
External links
edit
