2000 United States presidential election in Vermont
The 2000 United States presidential election in Vermont took place on November 7, 2000, and was part of the 2000 United States presidential election. Voters chose three representatives, or electors to the Electoral College, who voted for president and vice president.
| |||||||||||||||||||||||||||||||||||||
| |||||||||||||||||||||||||||||||||||||
| |||||||||||||||||||||||||||||||||||||
| |||||||||||||||||||||||||||||||||||||
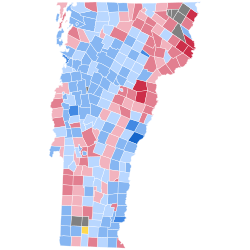
Vermont was won by Democratic Vice President Al Gore by 9.93 percentage points over Republican Governor of Texas George W. Bush, while third-party candidate Ralph Nader took nearly 7% of the vote (his second-best showing in the country by percentage).[1] Gore's win in Vermont marked the third consecutive victory for Democrats in Vermont, cementing the former Republican bastion's powerful shift towards the Democratic Party. This election marked the first time in history that a Republican won the presidency without carrying Vermont, as well as the first time that the Democratic Party carried the state with a majority of the vote for two elections in a row. This also marked the first time that Vermont would vote Democratic in a close presidential election, as well as the only time in history that the state has voted Democratic while neighboring New Hampshire has voted Republican.
As of the 2024 presidential election, this remains the last time that a Republican nominee has received more than 40% of the vote in Vermont, or that the margin of victory was in single digits. It also remains the last presidential election in which a Republican has carried Caledonia and Orange counties and the last one to carry Orleans County until Donald Trump narrowly won it in 2024. Bush became the first ever Republican to win the White House without carrying Bennington, Lamoille, Rutland, Washington, or Windsor Counties.
Vermont was one of ten states that backed George H. W. Bush for president in 1988 that didn't back George W. Bush in either 2000 or 2004.
To date,[when?] this is the last time that the city of Newport and the towns of Andover, Athens, Barnard, Barnet, Barton, Bradford, Braintree, Bridgewater, Brookfield, Burke, Cavendish, Chelsea, Chittenden, Corinth, Dorset, Fairfax, Ferrisburgh, Landgrove, Leicester, Londonderry, Manchester, Mendon, Newbury, North Hero, Pawlet, Plymouth, Vernon, Rupert, Sandgate, Shoreham, St. Johnsbury, Sunderland, Tinmouth, Tunbridge, Wallingford, Waterville, West Fairlee, Westfield, and Westmore voted Republican.
Primaries
editResults
edit| 2000 United States presidential election in Vermont[2] | |||||
|---|---|---|---|---|---|
| Party | Candidate | Votes | Percentage | Electoral votes | |
| Democratic | Al Gore | 149,022 | 50.63% | 3 | |
| Republican | George W. Bush | 119,775 | 40.70% | 0 | |
| Green/Progressive | Ralph Nader | 20,374 | 6.92% | 0 | |
| Reform | Pat Buchanan | 2,192 | 0.74% | 0 | |
| Vermont Grassroots | Dennis "Denny" Lane | 1,044 | 0.35% | 0 | |
| Libertarian | Harry Browne | 784 | 0.27% | 0 | |
| Natural Law | John Hagelin | 219 | 0.07% | 0 | |
| Liberty Union Party | David McReynolds | 161 | 0.05% | 0 | |
| Constitution | Howard Phillips | 153 | 0.05% | 0 | |
| Socialist Workers | James Harris | 70 | 0.02% | 0 | |
| Write-in | 514 | 0.17% | — | ||
| Totals | 294,308 | 100.00% | 7 | ||
| Voter turnout | 64% | +6% | |||
By county
edit| County | Al Gore Democratic |
George W. Bush Republican |
Ralph Nader Green/Progressive |
Various candidates Other parties |
Margin | Total votes cast | |||||
|---|---|---|---|---|---|---|---|---|---|---|---|
| # | % | # | % | # | % | # | % | # | % | ||
| Addison | 8,936 | 51.28% | 6,953 | 39.90% | 1,207 | 6.93% | 331 | 1.90% | 1,983 | 11.38% | 17,427 |
| Bennington | 9,021 | 51.03% | 7,284 | 41.21% | 1,112 | 6.29% | 260 | 1.48% | 1,737 | 9.82% | 17,677 |
| Caledonia | 5,859 | 42.95% | 6,746 | 49.45% | 771 | 5.65% | 265 | 1.94% | -887 | -6.50% | 13,641 |
| Chittenden | 39,156 | 54.37% | 26,105 | 36.25% | 5,769 | 8.01% | 987 | 1.37% | 13,141 | 18.12% | 72,017 |
| Essex | 1,129 | 39.04% | 1,564 | 54.08% | 133 | 4.60% | 66 | 2.28% | -435 | -15.04% | 2,892 |
| Franklin | 9,514 | 49.57% | 8,395 | 43.74% | 823 | 4.29% | 462 | 2.41% | 1,119 | 5.83% | 19,194 |
| Grand Isle | 1,835 | 50.44% | 1,550 | 42.61% | 174 | 4.78% | 79 | 2.17% | 285 | 7.83% | 3,638 |
| Lamoille | 5,676 | 50.47% | 4,456 | 39.62% | 878 | 7.81% | 236 | 2.09% | 1,220 | 10.85% | 11,246 |
| Orange | 6,694 | 45.55% | 6,858 | 46.67% | 888 | 6.04% | 255 | 1.73% | -164 | -1.12% | 14,695 |
| Orleans | 5,472 | 45.10% | 5,799 | 47.80% | 564 | 4.65% | 297 | 2.45% | -327 | -2.70% | 12,132 |
| Rutland | 13,990 | 47.65% | 13,546 | 46.13% | 1,355 | 4.61% | 471 | 1.61% | 444 | 1.52% | 29,362 |
| Washington | 15,281 | 51.37% | 11,448 | 38.48% | 2,433 | 8.18% | 587 | 1.98% | 3,833 | 12.89% | 29,749 |
| Windham | 11,319 | 52.67% | 7,358 | 34.24% | 2,475 | 11.52% | 339 | 1.58% | 3,961 | 18.43% | 21,491 |
| Windsor | 15,140 | 51.94% | 11,713 | 40.19% | 1,792 | 6.15% | 502 | 1.72% | 3,427 | 11.75% | 29,147 |
| Totals | 149,022 | 50.63% | 119,775 | 40.70% | 20,374 | 6.92% | 5,137 | 1.75% | 29,247 | 9.93% | 294,308 |
Counties that flipped from Democratic to Republican
edit- Caledonia (largest city: St. Johnsbury)
- Essex (largest city: Lunenburg)
- Orange (largest city: Randolph)
- Orleans (largest city: Derby)
By congressional district
editDue to the state's low population, only one congressional district is allocated. This district, called the At-Large district because it covers the entire state, is thus equivalent to the statewide election results.
| District | Bush | Gore | Representative |
|---|---|---|---|
| At-large | 40.7% | 50.63% | Bernie Sanders |
See also
editReferences
edit- ^ "2000 Presidential Election Statistics". Dave Leip’s Atlas of U.S. Presidential Elections. Retrieved March 5, 2018.
- ^ "2000 Presidential General Election Results - Vermont" (PDF). Dave Leip's Atlas of U.S. Elections. Dave Leip's Atlas of U.S. Elections. 2001. Retrieved March 14, 2009.


