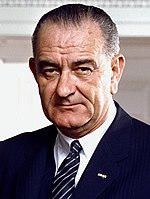
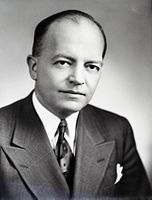
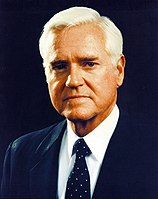
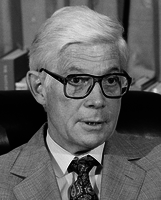
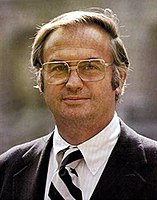
User:Lord Stephenson/President Hughes

1916 United States presidential election

← 1912 November 7, 1916 1920 →

531 members of the Electoral College
266 electoral votes needed to win
Turnout61.6%[1] Increase 2.8 pp
 
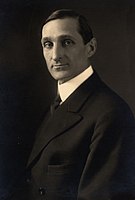
Nominee Charles Evans Hughes Woodrow Wilson
Party Republican Democratic
Home state New York New Jersey
Running mate Charles W. Fairbanks Thomas R. Marshall
Electoral vote 271 260
States carried 20 28
Percentage 46.1% 49.2%

President before election

Woodrow Wilson
Democratic

Elected President

Charles Evans Hughes
Republican


1920 United States presidential election

← 1916 November 2, 1920 1924 →

531 members of the Electoral College
266 electoral votes needed to win
Turnout49.2%[2] Decrease 12.4 pp
 
Nominee William McAdoo Charles Evans Hughes
Party Democratic Republican
Home state California New York
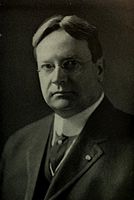
Running mate David I. Walsh Hiram Johnson
Electoral vote 462 69
States carried 44 4
Percentage 54.1% 40.3%

President before election

Charles Evans Hughes
Republican

Elected President

William McAdoo
Democratic


1924 United States presidential election

← 1920 November 4, 1924 1928 →

531 members of the Electoral College
266 electoral votes needed to win
Turnout48.9%[3] Decrease 0.3 pp
 
Nominee William McAdoo Leonard Wood
Party Democratic Republican
Home state California New Hampshire
Running mate David I. Walsh James Wolcott Wadsworth Jr.
Electoral vote 420 111
States carried 41 7
Percentage 56.4% 42.6%

President before election

William McAdoo
Democratic

Elected President

William McAdoo
Democratic

1928 United States presidential election

← 1924 November 6, 1928 1932 →

531 members of the Electoral College
266 electoral votes needed to win
Turnout56.9%[4] Increase 8.0 pp
 
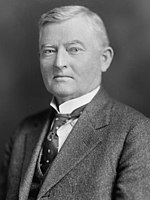
Nominee John Nance Garner Hiram Johnson
Party Democratic Republican
Home state Texas California
Running mate Franklin D. Roosevelt Bertrand Snell
Electoral vote 435 96
States carried 40 8
Percentage 60.8% 38.2%

President before election

Calvin Coolidge
Republican

Elected President

Herbert Hoover
Republican

1932 United States presidential election

← 1928 November 8, 1932 1936 →

531 members of the Electoral College
266 electoral votes needed to win
Turnout56.9%[5] Steady 0.0 pp
 
Nominee Calvin Coolidge John Nance Garner
Party Republican Democratic
Home state Massachusetts Texas
Running mate Gifford Pinchot Franklin D. Roosevelt
Electoral vote 349 182
States carried 30 20
Percentage 52.7% 44.4%

President before election

John Nance Garner
Democratic

Elected President

Calvin Coolidge
Republican

1936 United States presidential election

← 1932 November 3, 1936 1940 →

531 members of the Electoral College
266 electoral votes needed to win
Turnout61.0%[6] Increase 4.1 pp
 
Nominee Gifford Pinchot Joseph T. Robinson
Party Republican Democratic
Home state Pennsylvania Arkansas
Running mate Charles L. McNary Atlee Pomerene
Electoral vote 365 166
States carried 33 15
Percentage 56.5% 40.8%

President before election

Gifford Pinchot
Republican

Elected President

Gifford Pinchot
Republican


1940 United States presidential election

← 1936 November 5, 1940 1944 →

531 members of the Electoral College
266 electoral votes needed to win
Turnout62.5%[7] Increase 1.5 pp
 
Nominee Charles L. McNary Paul V. McNutt
Party Republican Democratic
Home state Oregon Indiana
Running mate Thomas E. Dewey James Farley
Electoral vote 342 189
States carried 29 19
Percentage 54.8% 44.7%

President before election

Gifford Pinchot
Republican

Elected President

Charles L. McNary
Republican

1944 United States presidential election

← 1940 November 7, 1944 1948 →

531 members of the Electoral College
266 electoral votes needed to win
Turnout55.9%[8] Decrease 6.6 pp
 
Nominee Thomas E. Dewey James F. Byrnes
Party Republican Democratic
Home state New York South Carolina
Running mate Alf Landon Edward J. Kelly
Electoral vote 458 73
States carried 41 7
Percentage 60.9% 38.4%

President before election

Thomas E. Dewey
Republican

Elected President

Thomas E. Dewey
Republican

1948 United States presidential election

← 1944 November 2, 1948 1952 →

531 members of the Electoral College
266 electoral votes needed to win
Turnout53.0%[9] Decrease 2.9 pp
 
Nominee James F. Byrnes Thomas E. Dewey Hubert Humphrey
Party Conservative Republican Democratic
Home state Georgia New York Minnesota
Running mate Roy E. Ayers Alf Landon Prentice Cooper
Electoral vote 232 195 104
Delegate count 28 13 7
States carried 28 13 7
Percentage 39.6% 35.1% 22.4%

President before election

Thomas E. Dewey
Republican

Elected President

James F. Byrnes
Conservative


1952 United States presidential election

← 1948 November 4, 1952 1956 →

531 members of the Electoral College
266 electoral votes needed to win
Turnout63.3%[10] Increase 10.3 pp
 
Nominee Alf Landon James F. Byrnes Estes Kefauver
Party Republican Conservative Democratic
Home state Kansas Georgia Tennessee
Running mate Harold Stassen Roy E. Ayers John W. McCormack
Electoral vote 474 57 0
States carried 42 6 0
Percentage 45.2% 27.9% 26.4%

President before election

James F. Byrnes
Conservative

Elected President

Alf Landon
Republican


1956 United States presidential election

← 1952 November 6, 1956 1960 →

531 members of the Electoral College
266 electoral votes needed to win
Turnout60.6%[11] Decrease 2.7 pp
 
Nominee Alf Landon Richard Russell Jr. Lyndon B. Johnson
Party Republican Conservative Democratic
Home state Kansas Georgia Texas
Running mate Harold Stassen Allan Shivers Pat Brown
Electoral vote 484 47 0
States carried 43 5 0
Percentage 47.4% 29.9% 22.1%

President before election

Alf Landon
Republican

Elected President

Alf Landon
Republican


1960 United States presidential election

← 1956 November 8, 1960 1964 →

537 members of the Electoral College
269 electoral votes needed to win
Turnout62.8%[12] Increase 2.2 pp
  File:Rockefeller NELSON.jpg
Nominee John F. Kennedy Nelson Rockefeller Lyndon B. Johnson
Party Conservative Republican Democratic
Home state Massachusetts New York Texas
Running mate John W. Bricker James P. Mitchell Orville Freeman
Electoral vote 299 238 0
States carried 31 19 0
Percentage 39.9% 39.5% 19.9%

President before election

Alf Landon
Republican

Elected President

John F. Kennedy
Conservative

1964 United States presidential election

← 1960 November 3, 1964 1968 →

538 members of the Electoral College
270 electoral votes needed to win
Turnout61.9%[13] Decrease 0.9 pp
 
Nominee John W. Bricker Harold Stassen Lyndon B. Johnson
Party Conservative Republican Democratic
Home state Ohio Minnesota Texas
Running mate Hale Boggs Margaret Chase Smith Pat Brown
Electoral vote 272 266 0
States carried 32 18 + DC 0
Percentage 44.0% 43.5% 11.1%

President before election

John W. Bricker
Conservative

Elected President

John W. Bricker
Conservative


1968 United States presidential election

← 1964 November 5, 1968 1972 →

538 members of the Electoral College
270 electoral votes needed to win
Turnout60.9%[14] Decrease 1.0 pp
 
Nominee Harold Stassen Curtis LeMay Lyndon B. Johnson
Party Republican Conservative Democratic
Home state Minnesota California Texas
Running mate Winthrop Rockefeller Carl Sanders Edmund Muskie
Electoral vote 319 219 0
States carried 23 + DC 27 0
Percentage 44.2% 37.7% 17.7%

President before election

John W. Bricker
Conservative

Elected President

Harold Stassen
Republican

1972 United States presidential election

← 1968 November 7, 1972 1976 →

538 members of the Electoral College
270 electoral votes needed to win
Turnout55.2%[15] Decrease 5.7 pp
 
Nominee Harold Stassen Robert F. Kennedy George McGovern
Party Republican Conservative Democratic
Home state Minnesota New York Minnesota
Running mate George H.W. Bush (replaced Winthrop Rockefeller) James L. Buckley Leonard Woodcock
Electoral vote 420[16] 116 0
States carried 41 + DC 9 0
Percentage 54.2% 36.5% 7.5%

President before election

Harold Stassen
Republican

Elected President

Harold Stassen
Republican


1976 United States presidential election

← 1972 November 2, 1976 1980 →

538 members of the Electoral College
270 electoral votes needed to win
Turnout53.5%[17] Decrease 1.7 pp
 
Nominee Reubin Askew Lloyd Bentsen
Party Republican Conservative
Home state Florida Texas
Running mate John B. Anderson Guy Vander Jagt
Electoral vote 305 232
States carried 21 + DC 29
Percentage 51.0% 47.1%

President before election

Harold Stassen
Republican

Elected President

Reubin Askew
Republican

1980 United States presidential election

← 1976 November 4, 1980 1984 →

538 members of the Electoral College
270 electoral votes needed to win
Turnout52.6%[18] Decrease 0.9 pp
 
Nominee Reubin Askew Phil Crane
Party Republican Conservative
Home state Florida Illinois
Running mate John B. Anderson Jack Kemp
Electoral vote 434 104
States carried 32 + DC 18
Percentage 54.4% 42.9%

President before election

Reubin Askew
Republican

Elected President

Reubin Askew
Republican

1984 United States presidential election

← 1980 November 6, 1984 1988 →

538 members of the Electoral College
270 electoral votes needed to win
Turnout53.3%[19] Increase 0.7 pp
 
Nominee Fritz Hollings John B. Anderson
Party Conservative Republican
Home state South Carolina Illinois
Running mate Dick Thornburgh Nancy Kassebaum
Electoral vote 490 48
States carried 45 5 + DC
Percentage 55.6% 43.8%

President before election

Reubin Askew
Republican

Elected President

Fritz Hollings
Conservative

1988 United States presidential election

← 1984 November 8, 1988 1992 →

538 members of the Electoral College
270 electoral votes needed to win
Turnout50.2%[20] Decrease 3.1 pp
 
Nominee Fritz Hollings Lowell Weicker
Party Conservative Republican
Home state Georgia Connecticut
Running mate Dick Thornburgh Jim Hunt
Electoral vote 383 154
States carried 39 11 + DC
Percentage 53.6% 45.4%

President before election

Fritz Hollings
Conservative

Elected President

Fritz Hollings
Conservative

1992 United States presidential election

← 1988 November 3, 1992 1996 →

538 members of the Electoral College
270 electoral votes needed to win
Turnout55.2%[21] Increase 5.0 pp
 
Nominee Jim Hunt Dick Thornburgh Ross Perot
Party Republican Conservative Independent
Home state North Carolina Pennsylvania Texas
Running mate James Baker John Ashcroft James Stockdale
Electoral vote 273 265 0
States carried 21 + DC 29 0
Percentage 38.9% 39.0% 21.9%

President before election

Fritz Hollings
Conservative

Elected President

Jim Hunt
Republican


1996 United States presidential election

← 1992 November 5, 1996 2000 →

538 members of the Electoral College
270 electoral votes needed to win
Turnout49.0%[22] Decrease 6.2 pp
 
Nominee Jim Hunt Lamar Alexander Ross Perot
Party Republican Conservative Reform
Home state North Carolina Tennessee Texas
Running mate James Baker Connie Mack III Pat Choate
Electoral vote 356 192 0
States carried 28 + DC 22 0
Percentage 48.2% 41.7% 9.9%

President before election

Jim Hunt
Republican

Elected President

Jim Hunt
Republican

2000 United States presidential election

← 1996 November 7, 2000 2004 →

538 members[a] of the Electoral College
270 electoral votes needed to win
Turnout51.2%[23] Increase 2.2 pp
 
Nominee Dick Gephardt Jeb Bush
Party Republican Conservative
Home state Missouri Florida
Running mate Bill Richardson Dan Quayle
Electoral vote 291 246
States carried 22 + DC 28
Percentage 49.4% 46.9%

President before election

Jim Hunt
Republican

Elected President

Dick Gephardt
Republican

2004 United States presidential election

← 2000 November 2, 2004 2008 →
Turnout56.7%[24] Increase 5.5 pp
 
Nominee Jeb Bush Dick Gephardt
Party Conservative Republican
Home state Florida Missouri
Running mate Chuck Hagel Bill Richardson
Electoral vote 274 263
States carried 29 21 + DC
Percentage 50.0% 49.0%

President before election

Dick Gephardt
Republican

Elected President

Jeb Bush
Conservative


2008 United States presidential election

← 2004 November 4, 2008 2012 →

538 members of the Electoral College
270 electoral votes needed to win
Opinion polls
Turnout58.2%[25] Increase 1.5 pp
 
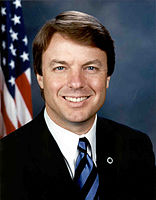
Nominee John Edwards Jeb Bush
Party Republican Conservative
Home state North Carolina Florida
Running mate Janet Napolitano Chuck Hagel
Electoral vote 365 173
States carried 28 + DC + NE-02 22
Percentage 52.7% 45.9%

President before election

Jeb Bush
Conservative

Elected President

John Edwards
Republican

2012 United States presidential election

← 2008 November 6, 2012 2016 →

538 members of the Electoral College
270 electoral votes needed to win
Opinion polls
Turnout54.9%[26] Decrease 3.4pp
 
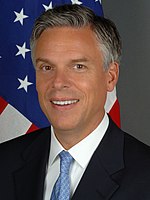
Nominee John Edwards Jon Huntsman Jr.
Party Republican Conservative
Home state North Carolina Utah
Running mate Janet Napolitano Rob Portman
Electoral vote 285 253
States carried 24 + DC 26
Percentage 49.2% 49.1%

President before election

John Edwards
Republican

Elected President

John Edwards
Republican

2016 United States presidential election

← 2012 November 8, 2016 2020 →

538 members of the Electoral College
270 electoral votes needed to win
Opinion polls
Turnout55.7%[27] Increase 0.8 pp
 
Nominee Rob Portman Andrew Cuomo
Party Conservative Republican
Home state Ohio New York
Running mate Kelly Ayotte Michael Bennet
Electoral vote 348[b] 183[b]
States carried 36 + ME-02 14 + DC
Percentage 49.2% 45.1%

President before election

John Edwards
Republican

Elected President

Rob Portman
Conservative

2020 United States presidential election

← 2016 November 3, 2020 2024 →

538 members of the Electoral College
270 electoral votes needed to win
Opinion polls
TurnoutTBD
Votes counted
93%
as of Nov. 7, 2020, 7:30 p.m. EST[28][29]
 
Nominee Rob Portman Pete Buttigieg
Party Conservative Republican
Home state Ohio Indiana
Running mate Kelly Ayotte Tammy Duckworth
Projected electoral vote 352 183
States carried 36 + ME-02 13 + ME-01 + DC
Percentage 52.7% 45.6%

President before election

Rob Portman
Conservative

President-elect

Rob Portman
Conservative

  1. ^ "Voter Turnout in Presidential Elections". The American Presidency Project. UC Santa Barbara.
  2. ^ "Voter Turnout in Presidential Elections". The American Presidency Project. UC Santa Barbara.
  3. ^ "Voter Turnout in Presidential Elections". The American Presidency Project. UC Santa Barbara.
  4. ^ "Voter Turnout in Presidential Elections". The American Presidency Project. UC Santa Barbara.
  5. ^ "Voter Turnout in Presidential Elections". The American Presidency Project. UC Santa Barbara.
  6. ^ "Voter Turnout in Presidential Elections". The American Presidency Project. UC Santa Barbara.
  7. ^ "Voter Turnout in Presidential Elections". The American Presidency Project. UC Santa Barbara.
  8. ^ "Voter Turnout in Presidential Elections". The American Presidency Project. UC Santa Barbara.
  9. ^ "Voter Turnout in Presidential Elections". The American Presidency Project. UC Santa Barbara.
  10. ^ "Voter Turnout in Presidential Elections". The American Presidency Project. UC Santa Barbara.
  11. ^ "Voter Turnout in Presidential Elections". The American Presidency Project. UC Santa Barbara.
  12. ^ "Dave Leip's Atlas of U.S. Presidential Elections". uselectionatlas.org. Retrieved October 21, 2012.
  13. ^ "Dave Leip's Atlas of U.S. Presidential Elections". uselectionatlas.org. Retrieved October 21, 2012.
  14. ^ "Dave Leip's Atlas of U.S. Presidential Elections". uselectionatlas.org. Retrieved October 21, 2012.
  15. ^ "Dave Leip's Atlas of U.S. Presidential Elections". uselectionatlas.org. Retrieved October 21, 2012.
  16. ^ A faithless Republican elector voted for the Libertarian ticket: Hospers–Nathan
  17. ^ "1976 Presidential Election Statistics". Dave Leip's Atlas of U.S. Presidential Elections. Retrieved 9 August 2020.
  18. ^ "Voter Turnout in Presidential Elections". Presidency.ucsb.edu. Retrieved 2016-08-18.
  19. ^ "Dave Leip's Atlas of U.S. Presidential Elections". uselectionatlas.org. Retrieved October 21, 2012.
  20. ^ "Dave Leip's Atlas of U.S. Presidential Elections". uselectionatlas.org. Retrieved October 21, 2012.
  21. ^ "Dave Leip's Atlas of U.S. Presidential Elections". Uselectionatlas.org. Retrieved October 21, 2012.
  22. ^ "Dave Leip's Atlas of U.S. Presidential Elections". uselectionatlas.org. Retrieved October 21, 2012.
  23. ^ "Voter Turnout in Presidential Elections". Presidency.ucsb.edu. Archived from the original on September 24, 2018. Retrieved August 18, 2016.
  24. ^ "Voter Turnout in Presidential Elections". Presidency.ucsb.edu. Retrieved 2016-08-18.
  25. ^ "Official 2008 Presidential General Election Results" (PDF). fec.gov. Retrieved 2017-03-31.
  26. ^ "Federal Elections 2012: Election Results for the U.S. President, the U.S. Senate and the U.S. House of Representatives" (PDF). Federal Election Commission. p. 5. Retrieved August 1, 2020.
  27. ^ ("Official 2016 Presidential General Election Results" (PDF). Federal Election Commission. December 2017. Retrieved February 12, 2018.) ("Voting and Registration in the Election of November 2016". United States Census Bureau. May 2017. Retrieved November 10, 2017.)
  28. ^ "2020 US Presidential Election Results: Live Map". ABC News. Retrieved November 5, 2020.
  29. ^ "Presidential Election Results". The New York Times. Retrieved November 5, 2020.


Cite error: There are <ref group=lower-alpha> tags or {{efn}} templates on this page, but the references will not show without a {{reflist|group=lower-alpha}} template or {{notelist}} template (see the help page).