2030 United States House of Representatives Election
United States
← 2028 November 5, 2030 2032 →

All 930 seats in the United States House of Representatives[a]
466 seats needed for a majority
Turnout63.82
Party Leader % Seats +/–
Democratic Hakeem Jeffries
Republican Mike Johnson
Libertarian Chase Oliver
Christian Nationalist Matt Gaetz
Green Anita Rios
Forward Andrew Yang
Democratic Socialist Alexandria Ocasio-Cortez
American Solidarity Desmond Silveira
Unity Bill Hammons
Reform-Alliance Darcy Richardson
Socialism and Liberation Eugene Puryear
This lists parties that won seats. See the complete results below.

2030 United States House of Representatives Election

edit

The 2030 United States House of Representatives elections were held on November 10, 2030, as part of the 2030 United States elections during incumbent president Kamala Harris's term. These were the first elections following the 2029 House Reforms, which increased the total number of seats from 435 to 930 and included multi-member districts based on new standards. All 930 seats, representing the 50 states of the Union were up for election, as well as the 24 seats of non-voting members of the House. Numerous other state, and local elections, including the 2029 U.S. gubernatorial elections, were also held simultaneously.

The Democratic Party lost its supermajority in the House, but still held a majority of seats. The Republican Party, despite the new electoral system, continued to lose seats, from 152 seats in the previous Congress to 127 in the 121st Congress. Following the 2026 collapse of the Republican Party, major resistance in the form of third parties became common and notably gained seats, the first time since William Carney and the Conservatives in 1978. This was the best federal electoral performance for the Libertarian, Green, Forward, American Solidarity, and Unity Parties. The American Patriot Movement (formerly the Save America Movement), despite losing their vote share last election, still gained seats due to the new system in place.

The new electoral system as a result of the 2029 House Reforms was criticized by many of the establishment figures in Congress.

  1. ^ As well as the 24 non-voting delegates.

2016 United States Presidential Election

edit
2016 United States presidential election
 
← 2012 November 8, 2016 2020 →

538 members of the Electoral College
270 electoral votes needed to win
Opinion polls
Turnout60.1%[1]   1.5 pp
       
Nominee Hillary Clinton Donald Trump Gary Johnson
Party Democratic Republican Libertarian
Home state New York New York New Mexico
Running mate Tim Kaine Mike Pence Bill Weld
Electoral vote 342[a] 189 [a] 7
States carried 25 + NE-02 + DC 23 1 + NE-01 + ME-02
Popular vote 61,753,436 [2] 56,686,345 [2] 14,887,902
Percentage 45.2% 41.5% 10.9%

 2016 United States presidential election in California2016 United States presidential election in Oregon2016 United States presidential election in Washington (state)2016 United States presidential election in Idaho2016 United States presidential election in Nevada2016 United States presidential election in Utah2016 United States presidential election in Arizona2016 United States presidential election in Montana2016 United States presidential election in Wyoming2016 United States presidential election in Colorado2016 United States presidential election in New Mexico2016 United States presidential election in North Dakota2016 United States presidential election in South Dakota2016 United States presidential election in Nebraska2016 United States presidential election in Kansas2016 United States presidential election in Oklahoma2016 United States presidential election in Texas2016 United States presidential election in Minnesota2016 United States presidential election in Iowa2016 United States presidential election in Missouri2016 United States presidential election in Arkansas2016 United States presidential election in Louisiana2016 United States presidential election in Wisconsin2016 United States presidential election in Illinois2016 United States presidential election in Michigan2016 United States presidential election in Indiana2016 United States presidential election in Ohio2016 United States presidential election in Kentucky2016 United States presidential election in Tennessee2016 United States presidential election in Mississippi2016 United States presidential election in Alabama2016 United States presidential election in Georgia2016 United States presidential election in Florida2016 United States presidential election in South Carolina2016 United States presidential election in North Carolina2016 United States presidential election in Virginia2016 United States presidential election in West Virginia2016 United States presidential election in the District of Columbia2016 United States presidential election in Maryland2016 United States presidential election in Delaware2016 United States presidential election in Pennsylvania2016 United States presidential election in New Jersey2016 United States presidential election in New York2016 United States presidential election in Connecticut2016 United States presidential election in Rhode Island2016 United States presidential election in Vermont2016 United States presidential election in New Hampshire2016 United States presidential election in Maine2016 United States presidential election in Massachusetts2016 United States presidential election in Hawaii2016 United States presidential election in Alaska2016 United States presidential election in the District of Columbia2016 United States presidential election in Maryland2016 United States presidential election in Delaware2016 United States presidential election in New Jersey2016 United States presidential election in Connecticut2016 United States presidential election in Rhode Island2016 United States presidential election in Massachusetts2016 United States presidential election in Vermont2016 United States presidential election in New Hampshire
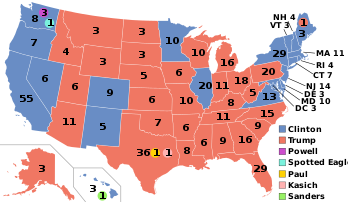
Presidential election results map. Red denotes states won by Trump/Pence and blue denotes those won by Clinton/Kaine. Numbers indicate electoral votes cast by each state and the District of Columbia. On election night, Trump won 306 electors and Clinton 232. However, because of seven faithless electors (five Democratic and two Republican), Trump received 304 votes and Clinton 227.

President before election

Barack Obama
Democratic

Elected President

Donald Trump
Republican

  1. ^ ("National General Election VEP Turnout Rates, 1789-Present". United States Election Project. CQ Press.)("Official 2016 Presidential General Election Results" (PDF). Federal Election Commission. December 2017. Retrieved February 12, 2018.) ("Voting and Registration in the Election of November 2016". United States Census Bureau. May 2017. Retrieved November 10, 2017.)
  2. ^ a b "FEDERAL ELECTIONS 2016 -- Election Results for the U.S. President, the U.S. Senate and the U.S. House of Representatives" (PDF). Federal Elections Commission. December 2017. Retrieved August 12, 2020.


Cite error: There are <ref group=lower-alpha> tags or {{efn}} templates on this page, but the references will not show without a {{reflist|group=lower-alpha}} template or {{notelist}} template (see the help page).