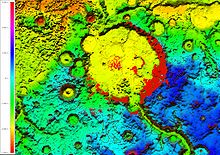
A viewshed is the geographical area that is visible from a location. It includes all surrounding points that are in line-of-sight with that location and excludes points that are beyond the horizon or obstructed by terrain and other features (e.g., buildings, trees). Conversely, it can also refer to area from which an object can be seen.[1] A viewshed is not necessarily "visible" to humans; the same concept is used in radio communications to indicate where a specific combination of transmitter, antenna, and terrain allow reception of signal.

Viewsheds are commonly used in terrain analysis, which is of interest to urban planning, archaeology, and military science. In urban planning, for example, viewsheds tend to be calculated for areas of particular scenic or historic value that are deemed worthy of preservation against development or other change. Viewsheds are often calculated for public areas — for example, from public roadways, public parks, or high-rise buildings. The preservation of viewsheds is frequently a goal in the designation of open space areas, green belts, and community separators.
Representation
editA viewshed can be represented by raster data indicating the visibility of a viewpoint for or from an area of interest. In a binary representation, a cell (shown graphically as a pixel) with a value of 1 (or "true") indicates that the viewpoint is visible from that cell, while a value of 0 (false) indicates that the viewpoint is not visible. In certain disciplines, such as radio communications, "visibility" may be probabilistic and therefore the viewshed may be represented with non-integer values. Viewsheds for multiple points, lines, or areas may have counts or fractional values for queries involving "how much" or "how many" (e.g., how much of a highway is visible?).
Viewshed and total-viewshed computation
editA terrain can be represented using a regular grid of points called Digital Elevation Model (DEM). Where each point of the DEM is represented by its coordinates X, Y and its height Z.
Viewshed calculation on a large DEM is costly from a computational point of view. This cost is much higher when calculating the viewshed for all the points of the DEM, also called total-viewshed. A faster algorithm for computing the total-viewshed of large DEMs was proposed on.[2]
History
editClifford Tandy is credited with coining the term "viewshed" in 1967 by analogy to watershed.[3] The lexicographer Grant Barrett cites a use of the term from 1970 in the Oakland Tribune.[4]
Related concepts
editViewsheds are a specific type of visibility graph.
Isovists are a closely related concept that is more common in the study of architecture. Viewsheds and isovists are sometimes said to be equivalent,[5] however others have found differences between them. It has been argued that isovists are more focused on representing space whereas viewsheds are about the visibility of features.[6] Also, the problems they are used in have different scales. Planners use viewsheds where terrain heights come into play whereas architects do not typically take that into account with isovists.[6]
The area from which a structure can be seen may be called the "Zone of Visual Influence." This can be referred to as the viewshed as well, though.
Total-viewshed map refers to the map, where each point represents the number of Km² visible at that point in the DEM.[2]
The 3D-viewshed of a point (X,Y) of the DEM consists of the visible space from that point.[7]
Zone of visual influence
editA zone of visual influence is the area from which a development or other structure is theoretically visible.[8] It is usually represented as a map using color to indicate visibility.
Zones of visual influence are used to identify the parts of a landscape that will be affected by a development. They are of particular use to landscape architects in determining visual intrusion as part of an environmental impact assessment. Zones of visual influence have been used extensively in wind farm development. A map will be created showing the number of wind turbines that are visible from a particular area. A cumulative zone of visual influence is used to define the cumulative effects of many developments.
See also
editReferences
edit- ^ Visual Impact Assessment for Highway Projects (PDF). Washington, DC: U.S. Department of Transportation, Federal Highway Administration, Office of Environmental Policy. September 1990. pp. 26–33, 123. Publication number FHWA-HI-88-054.
- ^ a b Tabik, S; Cervilla, A; Zapata, E; Romero, F (2015). "Efficient data structure and highly scalable algorithm for total-viewshed computation". IEEE Journal of Selected Topics in Applied Earth Observations and Remote Sensing. 8 (1): 304–310. Bibcode:2015IJSTA...8..304T. doi:10.1109/jstars.2014.2326252. S2CID 23232474.
- ^ Nijhuis, Steffen; van Lammeren, Ron; Antrop, Marc (September 2011). "Exploring the Visual Landscape - Introduction". Research in Urbanism Series. 2: 30. doi:10.7480/rius.2.205.
- ^ Barrett, Grant (March 27, 2006). "viewshed". A Way with Words. Retrieved March 10, 2015.
- ^ Turner, A; Doxa, M; O'Sullivan, D; Penn, A (2001). "From isovists to visibility graphs: a methodology for the analysis of architectural space". Environment and Planning B: Planning and Design. 28 (1): 103–121. Bibcode:2001EnPlB..28..103T. doi:10.1068/b2684. S2CID 17332950.
- ^ a b Weitkamp, Gerd (September 2011). "Mapping landscape openness with isovists". Research in Urbanism Series. 2: 208. doi:10.7480/rius.2.213. ISSN 1879-8217.
- ^ Cervilla, A; Tabik, S; Vías, J; Mérida, M; Romero, F (2016). "Total 3D-viewshed Map: Quantifying the Visible Volume in Digital Elevation Models". Transactions in GIS. 21 (3): 304–310. doi:10.1111/tgis.12216. hdl:10630/29115. S2CID 29701632.
- ^ Association, European Wind Energy European Wind Energy (2012-05-04). Wind Energy - The Facts: "A Guide to the Technology, Economics and Future of Wind Power". Routledge. p. 540. ISBN 9781136548598. Retrieved 8 July 2019.
- ^ Morris, Peter; Therivel, Riki (2009-03-05). Methods of Environmental Impact Assessment. Routledge. pp. 450–. ISBN 9780203892909. Retrieved 15 February 2013.