Template:Infobox tropical cyclone/testcases

current

edit
Infobox hurricane current Infobox hurricane/sandbox
Tropical Storm Wali
Current storm status
Tropical depression (1-min mean)
Satellite image
Forecast map
As of:11 a.m. HST (2100 UTC) July 18
Location:16°00′N 144°00′W / 16.0°N 144.0°W / 16.0; -144.0 (Tropical Storm Wali) ± 30 nm
About 775 mi (1,245 km) ESE of Hilo, Hawaii
Sustained winds:30 knots (35 mph; 55 km/h) (1-min mean)
gusting to 40 knots (45 mph; 75 km/h)
Pressure:1007 mbar (hPa; 29.74 inHg)
Movement:NW at 11 knots (13 mph; 20 km/h)
See more detailed information.
Tropical Storm Wali
Tropical depression (SSHWS/NWS)
Current storm status
As of: 11 a.m. HST (2100 UTC) July 18
Location16°00′N 144°00′W / 16.0°N 144.0°W / 16.0; -144.0 ± 30 nm
About 775 mi (1,245 km) ESE of Hilo, Hawaii
MovementNW at 11 knots (13 mph; 20 km/h)
Winds1-minute sustained: 35 mph (55 km/h)
Gusts: 45 mph (75 km/h)
Pressure1007 mbar (hPa); 29.74 inHg
Infobox hurricane current Infobox hurricane/sandbox
Rammasun
Current storm status
Typhoon  (JMA)
Current storm status
Category 4 typhoon (1-min mean)
Satellite image
Forecast map
As of:21:00 UTC, July 18
Location:21°18′N 108°54′E / 21.3°N 108.9°E / 21.3; 108.9
About 196 nmi (363 km; 226 mi) E of Hanoi, Vietnam
Sustained winds:85 knots (155 km/h) (10-min mean)
125 knots (230 km/h) (1-min mean)
gusting to 120 knots (225 km/h)
Pressure:945 mbar (27.91 inHg)
Movement:NW at 11 kn (20 km/h; 13 mph)
See more detailed information.
Rammasun
Typhoon (JMA scale)
Category 4 typhoon (SSHWS)
Current storm status
As of: 21:00 UTC, July 18
Location21°18′N 108°54′E / 21.3°N 108.9°E / 21.3; 108.9
About 196 nmi (363 km; 226 mi) E of Hanoi, Vietnam
MovementNW at 11 kn (20 km/h; 13 mph)
Winds10-minute sustained: 155 km/h (100 mph)
1-minute sustained: 230 km/h (145 mph)
Gusts: 220 km/h (140 mph)
Pressure945 hPa (mbar); 27.91 inHg
See more detailed information

No image

edit
image, no track
{{Infobox tropical cyclone}}{{Infobox tropical cyclone/sandbox}}
Tropical Storm Wali
Tropical storm (SSHWS/NWS)
storm doing things
Current storm status
As of: 21:00 UTC, July 17
Location12°48′N 140°48′W / 12.8°N 140.8°W / 12.8; -140.8
About 1060 mi (1705 km) ESE of Hilo, Hawaii
MovementNW at 8 kn (9 mph; 15 km/h)
Winds1-minute sustained: 45 mph (75 km/h)
Gusts: 60 mph (95 km/h)
Pressure1001 mbar (hPa); 29.56 inHg
track, no image
{{Infobox tropical cyclone}}{{Infobox tropical cyclone/sandbox}}
Tropical Storm Wali
Tropical storm (SSHWS/NWS)
Forecast map
Current storm status
As of: 21:00 UTC, July 17
Location12°48′N 140°48′W / 12.8°N 140.8°W / 12.8; -140.8
About 1060 mi (1705 km) ESE of Hilo, Hawaii
MovementNW at 8 kn (9 mph; 15 km/h)
Winds1-minute sustained: 45 mph (75 km/h)
Gusts: 60 mph (95 km/h)
Pressure1001 mbar (hPa); 29.56 inHg
No image, no track (no images should show in test)
{{Infobox tropical cyclone}}{{Infobox tropical cyclone/sandbox}}
Tropical Storm Wali
Tropical storm (SSHWS/NWS)
Current storm status
As of: 21:00 UTC, July 17
Location12°48′N 140°48′W / 12.8°N 140.8°W / 12.8; -140.8
About 1060 mi (1705 km) ESE of Hilo, Hawaii
MovementNW at 8 kn (9 mph; 15 km/h)
Winds1-minute sustained: 45 mph (75 km/h)
Gusts: 60 mph (95 km/h)
Pressure1001 mbar (hPa); 29.56 inHg
Mistyped/missing image/track files (no images should show in test)
{{Infobox tropical cyclone}}{{Infobox tropical cyclone/sandbox}}
Tropical Storm Wali
Tropical storm (SSHWS/NWS)
Current storm status
As of: 21:00 UTC, July 17
Location12°48′N 140°48′W / 12.8°N 140.8°W / 12.8; -140.8
About 1060 mi (1705 km) ESE of Hilo, Hawaii
MovementNW at 8 kn (9 mph; 15 km/h)
Winds1-minute sustained: 45 mph (75 km/h)
Gusts: 60 mph (95 km/h)
Pressure1001 mbar (hPa); 29.56 inHg
Tropical Storm Wali
Tropical storm (SSHWS/NWS)
Current storm status
As of: 21:00 UTC, July 17
Location12°48′N 140°48′W / 12.8°N 140.8°W / 12.8; -140.8
About 1060 mi (1705 km) ESE of Hilo, Hawaii
MovementNW at 8 kn (9 mph; 15 km/h)
Winds1-minute sustained: 45 mph (75 km/h)
Gusts: 60 mph (95 km/h)
Pressure1001 mbar (hPa); 29.56 inHg
Track used on dissipated storm
Side by side comparison
{{Infobox tropical cyclone}}{{Infobox tropical cyclone/sandbox}}
Tropical Depression Ten
Tropical Depression (SSHWS/NWS)
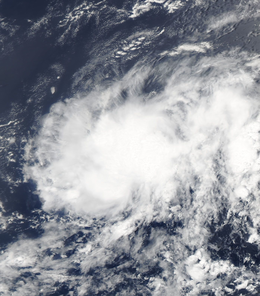
Satellite image of elliptical cloud pattern with no clear center
Tropical Depression Ten
FormedAugust 13, 2005
DissipatedAugust 14, 2005
Highest winds1-minute sustained: 35 mph (55 km/h)
Lowest pressure1008 mbar (hPa); 29.77 inHg
FatalitiesNone reported
DamageNone
Areas affectedNone
Part of the 2005 Atlantic hurricane season
Tropical Depression Ten
Tropical Depression (SSHWS/NWS)
Satellite image of elliptical cloud pattern with no clear center
Tropical Depression Ten
FormedAugust 13, 2005
DissipatedAugust 14, 2005
Highest winds1-minute sustained: 35 mph (55 km/h)
Lowest pressure1008 mbar (hPa); 29.77 inHg
FatalitiesNone reported
DamageNone
Areas affectedNone
Part of the 2005 Atlantic hurricane season
Side by side comparison
{{Infobox tropical cyclone}}{{Infobox tropical cyclone/sandbox}}
Great Hurricane of 1780
Hurricane San Calixto[1]
Great Hurricane of the Antilles[1]
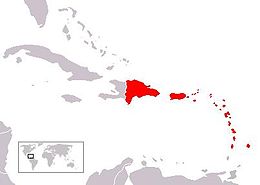
A map showing most of the Lesser Antilles in red. Puerto Rico and the Dominican Republic are also red.
Areas affected by the hurricane (excluding Bermuda)
FormedOctober 9, 1780 (1780-10-09)
DissipatedOctober 20, 1780 (1780-10-21)
Highest windsGusts: PREGUSTS 200 mph (320 km/h)
Fatalities20,000+ total
Areas affectedLesser Antilles, Puerto Rico, Hispaniola, Bermuda, possibly East Florida and some U. S. states
Part of the 1780 Atlantic hurricane season
Side by side comparison
{{Infobox tropical cyclone}}{{Infobox tropical cyclone/sandbox}}
Hurricane Dean
Category 5 major hurricane (SSHWS/NWS)
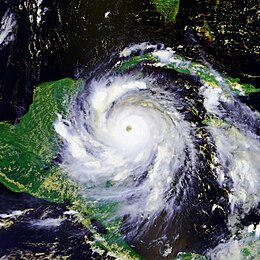
A view of Hurricane Dean from Space on August 20, 2007. Dean is a mature and well-developed hurricane, with a pronounced eye and well-defined banding features. The storm is located south of Cuba and east of the Yucatan Peninsula.
Hurricane Dean approaching the Yucatán Peninsula
FormedAugust 13, 2007
DissipatedAugust 23, 2007
Highest winds1-minute sustained: 175 mph (280 km/h)
Lowest pressure905 mbar (hPa); 26.72 inHg
Fatalities40 direct, 5 indirect
Damage$1.5 billion (2007 USD)
Areas affectedWindward Islands (especially St. Lucia, Martinique and Dominica), Leeward Islands, Puerto Rico, Dominican Republic, Haiti, Jamaica, Cayman Islands, Mexico, Belize, Honduras, Nicaragua
Part of the 2007 Atlantic hurricane season
Part of a series on Hurricane Dean

EPac

edit
Side by side comparison
{{Infobox tropical cyclone}}{{Infobox tropical cyclone/sandbox}}
Hurricane Linda
Category 3 major hurricane (SSHWS/NWS)
Hurricane Linda at peak intensity on September 8
FormedSeptember 5, 2015
DissipatedSeptember 14, 2015
(Remnant low after September 10)
Highest winds1-minute sustained: 125 mph (205 km/h)
Lowest pressure950 mbar (hPa); 28.05 inHg
Fatalities22 total
DamageAt least $30,000 (2015 USD)
(Mexico total only)
Areas affectedSinaloa, Oaxaca, Zacatecas, Southwestern United States
Part of the 2015 Pacific hurricane season
Side by side comparison
{{Infobox tropical cyclone}}{{Infobox tropical cyclone/sandbox}}
Hurricane Celia
Category 5 major hurricane (SSHWS/NWS)
Hurricane Celia as a Category 4 storm on June 24
FormedJune 18, 2010
DissipatedJune 30, 2010
(Remnant low after June 28)
Highest winds1-minute sustained: 160 mph (260 km/h)
Lowest pressure921 mbar (hPa); 27.2 inHg
(Estimated)
FatalitiesNone reported
DamageNone
Areas affectedOaxaca, Guerrero and Clipperton Island
Part of the 2010 Pacific hurricane season

WPac

edit
Side by side comparison
{{Infobox tropical cyclone}}{{Infobox tropical cyclone/sandbox}}
Typhoon Tip
Violent typhoon (JMA scale)
Category 5 super typhoon (SSHWS)
Typhoon Tip at its record peak intensity on October 12, 1979
FormedOctober 4, 1979
DissipatedOctober 19, 1979
Highest winds10-minute sustained: 260 km/h (160 mph)
1-minute sustained: 305 km/h (190 mph)
Lowest pressure870 hPa (mbar); 25.69 inHg
(Worldwide record low)
Fatalities86 direct, 13 indirect
Total: 99 fatalities
Areas affectedGuam, Japan
Part of the 1979 Pacific typhoon season
Typhoon Tip
Typhoon (JMA scale)
Category 5 super typhoon (SSHWS)
Typhoon Tip at its record peak intensity on October 12, 1979
FormedOctober 4, 1979
DissipatedOctober 19, 1979
Highest winds10-minute sustained: 260 km/h (160 mph)
1-minute sustained: 305 km/h (190 mph)
Lowest pressure870 hPa (mbar); 25.69 inHg
(Worldwide record low)
Fatalities86 direct, 13 indirect
Total: 99 fatalities
Areas affectedGuam, Japan
Part of the 1979 Pacific typhoon season
Side by side comparison
{{Infobox tropical cyclone}}{{Infobox tropical cyclone/sandbox}}
Very Severe Cyclonic Storm Phailin
Extremely severe cyclonic storm (IMD scale)
Category 5 tropical cyclone (SSHWS)
Phailin near peak intensity on October 11
FormedOctober 4, 2013 (2013-10-04)
DissipatedOctober 14, 2013 (2013-10-14)
Highest winds3-minute sustained: 215 km/h (130 mph)
1-minute sustained: 260 km/h (160 mph)
Lowest pressurePRESSUREPRE_TEXT 940 hPa (mbar); 27.76 inHg
(Estimated at 918 hPa (27.11 inHg) by the JTWC)
Fatalities45 total
Damage$696 million (2013 USD)
Areas affectedThailand, Myanmar, India
Part of the 2013 Pacific typhoon season and
the North Indian Ocean cyclone season
Side by side comparison
{{Infobox tropical cyclone}}{{Infobox tropical cyclone/sandbox}}
Very Intense Tropical Cyclone Hellen
Very intense tropical cyclone (SWIO scale)
Category 4 tropical cyclone (SSHWS)
Cyclone Hellen explosively intensifying on March 30 over the Mozambique Channel
FormedMarch 27, 2014
DissipatedApril 1, 2014
Highest winds10-minute sustained: 230 km/h (145 mph)
1-minute sustained: 240 km/h (150 mph)
Lowest pressure925 hPa (mbar); 27.32 inHg
Fatalities8 total, 9 missing
Areas affectedMozambique, Comoros, Mayotte, Madagascar
Part of the 2013–14 South-West Indian Ocean cyclone season
Side by side comparison
{{Infobox tropical cyclone}}{{Infobox tropical cyclone/sandbox}}
Severe Tropical Cyclone Orson - 5
Category 5 severe tropical cyclone (Aus scale)
Category 5 tropical cyclone (SSHWS)
Satellite image of a powerful cyclone near the coast of Western Australia. The storm is very mature, with a large area of deep thunderstorms and a well-defined, clear eye.
Satellite image of Cyclone Orson near peak intensity
Formed17 April 1989
Dissipated24 April 1989
Highest winds10-minute sustained: 250 km/h (155 mph)
1-minute sustained: 260 km/h (160 mph)
Lowest pressure904 hPa (mbar); 26.7 inHg
(Fourth lowest pressure in Australian basin[2])
Fatalities5 direct
Damage$16.8 million (1989 USD)
Areas affectedWestern Australia
Part of the 1988-89 Australian region cyclone season
Side by side comparison
{{Infobox tropical cyclone}}{{Infobox tropical cyclone/sandbox}}
Severe Tropical Cyclone Tracy - 4
Category 4 severe tropical cyclone (Aus scale)
Category 3 tropical cyclone (SSHWS)
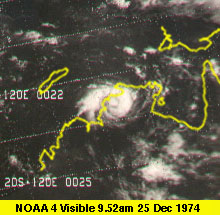
Cyclone Tracy near Darwin landfall
Formed21 December 1974 (1974-12-21)
Dissipated26 December 1974 (1974-12-26)
Highest winds10-minute sustained: 175 km/h (110 mph)
1-minute sustained: 205 km/h (125 mph)
Gusts: 240 km/h (150 mph)
Lowest pressure950 hPa (mbar); 28.05 inHg
Fatalities71
Damage$800 million (1974 USD)
Areas affectedTiwi Islands, Darwin, Northern Territory
Part of the 1974–75 Australian region cyclone season
Side by side comparison
{{Infobox tropical cyclone}}{{Infobox tropical cyclone/sandbox}}
Severe Tropical Cyclone Rona-Frank - 3
Category 3 severe tropical cyclone (Aus scale)
Category 3 tropical cyclone (SSHWS)
Image of Severe Tropical Cyclone Frank near landfall on New Caledonia.
FormedFebruary 10, 1999
DissipatedFebruary 27, 1999
(Extratropical after February 21, 1999)
Highest winds10-minute sustained: 150 km/h (90 mph)
1-minute sustained: 185 km/h (115 mph)
Lowest pressure955 hPa (mbar); 28.2 inHg
Fatalities7
Damage$150 million (1999 USD)
Areas affectedEastern Australia and New Caledonia
Part of the 1998–99 Australian region and the South Pacific cyclone seasons
Side by side comparison
{{Infobox tropical cyclone}}{{Infobox tropical cyclone/sandbox}}
Tropical Cyclone Les - 2
Category 2 tropical cyclone (Aus scale)
Tropical storm (SSHWS)
Tropical Cyclone Les on January 24, 1998
Formed19 January 1998 (1998-01-19)
Dissipated1 February 1998 (1998-03)
Highest winds10-minute sustained: 110 km/h (70 mph)
1-minute sustained: 95 km/h (60 mph)
Gusts: 140 km/h (85 mph)
Lowest pressure976 hPa (mbar); 28.82 inHg
Fatalities3 direct
Damage> $64.7 million (1998 USD)
Areas affectedQueensland, Northern Territory, Western Australia
Part of the 1997-98 Australian region cyclone season
Side by side comparison
{{Infobox tropical cyclone}}{{Infobox tropical cyclone/sandbox}}
Tropical Cyclone Oswald - 1
Category 1 tropical cyclone (Aus scale)
Tropical storm (SSHWS)
Satellite image of Tropical Cyclone Oswald on 21 January as it made landfall in Queensland
Formed17 January 2013
Dissipated28 January 2013
Highest winds10-minute sustained: 65 km/h (40 mph)
1-minute sustained: 85 km/h (50 mph)
Lowest pressure992 hPa (mbar); 29.29 inHg
Fatalities6 (1 person missing)
Damage$2.28 billion (2013 USD)
Areas affectedQueensland, New South Wales
Part of the 2012–13 Australian region cyclone season
Side by side comparison
{{Infobox tropical cyclone}}{{Infobox tropical cyclone/sandbox}}
Severe Tropical Cyclone Clare - 3
Category 3 severe tropical cyclone (Aus scale)
Tropical storm (SSHWS)
Satellite image of Cyclone Clare
Formed6 January 2006
Dissipated10 January 2006
Highest winds10-minute sustained: 140 km/h (85 mph)
1-minute sustained: 110 km/h (70 mph)
Lowest pressure960 hPa (mbar); 28.35 inHg
FatalitiesNone reported
Damage$2.3 million (2006 USD)
Areas affectedWestern Australia
Part of the 2005–06 Australian region cyclone season
Side by side comparison
{{Infobox tropical cyclone}}{{Infobox tropical cyclone/sandbox}}
Severe Tropical Cyclone Joan - 5
Category 5 severe tropical cyclone (Aus scale)
Category 4 tropical cyclone (SSHWS)
Formed30 November 1975
Dissipated10 December 1975
Highest winds10-minute sustained: 230 km/h (145 mph)
1-minute sustained: 230 km/h (145 mph)
Gusts: 260 km/h (160 mph)
Lowest pressure915 hPa (mbar); 27.02 inHg
FatalitiesNone
Damage$31 million (1975 USD)
Areas affectedWestern Australia
Part of the 1975–76 Australian region cyclone season

SPac

edit
Side by side comparison
{{Infobox tropical cyclone}}{{Infobox tropical cyclone/sandbox}}
Tropical Depression 04F
Tropical depression (Aus scale)
Tropical Depression 04F
FormedJanuary 4, 2009
DissipatedJanuary 12, 2009
Highest winds10-minute sustained: 55 km/h (35 mph)
Gusts: 110 km/h (70 mph)
Lowest pressure994 hPa (mbar); 29.35 inHg
Fatalities12 total
Damage$45 million (2009 USD)
Areas affectedBa, Nadi, Rakiraki, Labasa, Sigatoka
Part of the 2008–09 South Pacific cyclone season
Tropical Depression 04F
Tropical depression (Aus scale)
Tropical Depression 04F
FormedJanuary 4, 2009
DissipatedJanuary 12, 2009
Highest winds10-minute sustained: 55 km/h (35 mph)
Gusts: 110 km/h (70 mph)
Lowest pressure994 hPa (mbar); 29.35 inHg
Fatalities12 total
Damage$45 million (2009 USD)
Areas affectedBa, Nadi, Rakiraki, Labasa, Sigatoka
Part of the 2008–09 South Pacific cyclone season

Subtropical storms

edit
Side by side comparison
{{Infobox tropical cyclone}}{{Infobox tropical cyclone/sandbox}}
Subtropical Storm Andrea
Subtropical storm (SSHWS/NWS)
Andrea, shortly before being classified as a subtropical storm
FormedMay 9, 2007
DissipatedMay 11, 2007
Highest winds1-minute sustained: 60 mph (95 km/h)
Lowest pressure1000 mbar (hPa); 29.53 inHg
Fatalities6 indirect
Damage$800,000 (2007 USD)
Areas affectedVirginia, North Carolina, South Carolina, Georgia, Florida, Bahamas
Part of the 2007 Atlantic hurricane season

Weird tests

edit
No parameters defined
{{Infobox tropical cyclone}}{{Infobox tropical cyclone/sandbox}}
Infobox tropical cyclone/testcases
parameters doing all the wrong things
{{Infobox tropical cyclone}}{{Infobox tropical cyclone/sandbox}}
track_caption
Current storm status
As of: 00:00 UTC
Location45°N 45°W / 45°N 45°W / 45; -45
Movementthat way at 10kn
FormedJuly 16, 2014 (2014-07-16)
(Extratropical after July 20, 2014 (2014-07-20))
Winds10-minute sustained: prefix10min 185 km/h (115 mph)
3-minute sustained: prefix3min 185 km/h (115 mph)
1-minute sustained: prefix1min 185 km/h (115 mph)
Gusts: 220 km/h (140 mph)
Pressure≤pressurepre≥ 1000 hPa (mbar); 29.53 inHg
(pressurepost)
Fatalities1
DamageDamagespre one billion
(Damagespost)
Areas affectedWikiProject Tropical cyclones
misc
Part of the Template:Infobox hurricane/sandbox
Part of a series on [[Category:Hurricane infobox templates]]
track_caption
Current storm status
As of: 00:00 UTC
Location45°N 45°W / 45°N 45°W / 45; -45
Movementthat way at 10kn
FormedJuly 16, 2014 (2014-07-16)
(Extratropical after July 20, 2014 (2014-07-20))
Winds10-minute sustained: prefix10min 185 km/h (115 mph)
3-minute sustained: prefix3min 185 km/h (115 mph)
1-minute sustained: prefix1min 185 km/h (115 mph)
Gusts: 220 km/h (140 mph)
Pressure≤pressurepre≥ 1000 hPa (mbar); 29.53 inHg
(pressurepost)
Fatalities1
DamageDamagespre one billion
(Damagespost)
Areas affectedWikiProject Tropical cyclones
misc
Part of a series on [[Category:Hurricane infobox templates]]
All parameters defined (except dissipated)
{{Infobox tropical cyclone}}{{Infobox tropical cyclone/sandbox}}
Cyclone Infobox
Category 4 severe tropical cyclone (Aus scale)
Category 3 tropical cyclone (SSHWS)
track_caption
Current storm status
As of: 00:00 UTC
Location45°N 45°W / 45°N 45°W / 45; -45
Movementthat way at 10kn
FormedJuly 16, 2014 (2014-07-16)
(Extratropical after July 20, 2014 (2014-07-20))
Winds10-minute sustained: prefix10min 185 km/h (115 mph)
3-minute sustained: prefix3min 185 km/h (115 mph)
1-minute sustained: prefix1min 185 km/h (115 mph)
Gusts: 220 km/h (140 mph)
Pressure≤pressurepre≥ 1000 hPa (mbar); 29.53 inHg
(pressurepost)
Fatalities1
DamageDamagespre $1 billion (2014 BTC)
(Damagespost)
Areas affectedWikiProject Tropical cyclones
misc
Part of the Template:Infobox hurricane/sandbox
See more detailed information
Cyclone Infobox
Category 4 severe tropical cyclone (Aus scale)
Category 3 tropical cyclone (SSHWS)
track_caption
Current storm status
As of: 00:00 UTC
Location45°N 45°W / 45°N 45°W / 45; -45
Movementthat way at 10kn
FormedJuly 16, 2014 (2014-07-16)
(Extratropical after July 20, 2014 (2014-07-20))
Winds10-minute sustained: prefix10min 185 km/h (115 mph)
3-minute sustained: prefix3min 185 km/h (115 mph)
1-minute sustained: prefix1min 185 km/h (115 mph)
Gusts: 220 km/h (140 mph)
Pressure≤pressurepre≥ 1000 hPa (mbar); 29.53 inHg
(pressurepost)
Fatalities1
DamageDamagespre $1 billion (2014 BTC)
(Damagespost)
Areas affectedWikiProject Tropical cyclones
misc
See more detailed information

References

  1. ^ a b Mújica-Baker, Frank. Huracanes y Tormentas que han afectado a Puerto Rico (PDF). Estado Libre Asociado de Puerto Rico, Agencia Estatal para el manejo de Emergencias y Administracion de Desastres. p. 11. Retrieved August 30, 2010.
  2. ^ Buchan, S.J.; Tron, S.M.; Lemm A.J. (4 September 2002). Measured Tropical Cyclone Seas (PDF). 7th International Workshop on Wave hindcasting and forecasting preprints. Banff, Alberta, Canada. Archived from the original on 12 April 2012. Retrieved 12 April 2012.